The GLDTracker™
Where is the GLD ETF (Gold ETF) Headed?
If you don't know the secret of investing in gold, this is a must read: pass on the link to anyone who needs to know when gold is a bust and when it's a must...
Gold: When It Declines and When It Shines
After reviewing the above, take a look at the...
For further up to date comments, be sure to follow me on Twitter (@SunAndStormInv) this week here: SunAndStormInv on Twitter
For the fastest view of my posts, please see me on StockTwits, where I am a suggested writer as @SunAndStorm™. I suggest you subscribe to both X and StockTwits, because sometimes systems are congested or crash...
The newest chart is on the Market Timing Blog. Click the 2nd button down on the blue bar to the upper left.
The following charts represent archived material. You may pick up some charting tips by reviewing some of them and get a feel for how gold (GLD ETF) has traded over time.
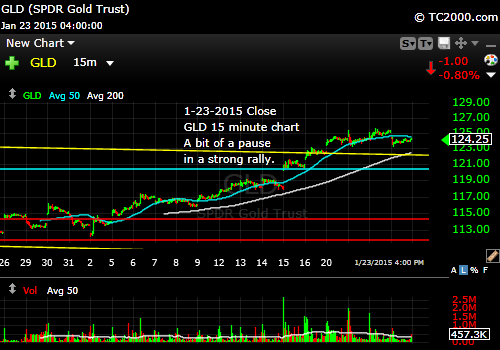
1-23-2015 Gold ETF, 15 minute chart:
Please like the page below too!
As always, it's your money and your decision as to how to invest it.
As always, it's your money and your decision as to how to invest it.
I also thank Worden Brothers for their charting system, which allows me to do my work quickly.
If you want to know more about the charting system I use every day, go to my "Other Resources" page on this site (see bottom of the blue bar to upper left).
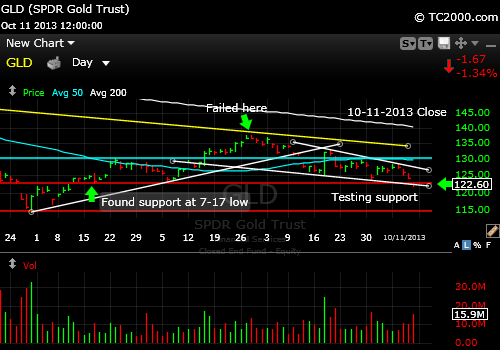
10-11-2013 Gold ETF:
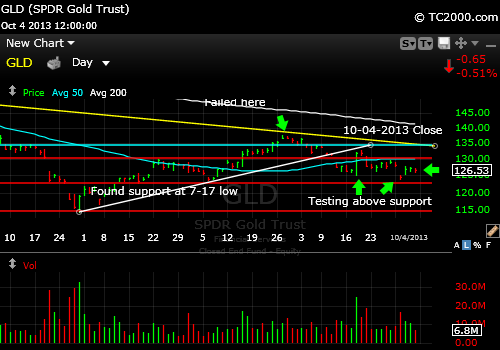
10-04-2013 Gold ETF: Read the text by subscribing to the upper right.
As always, it's your money and your decision as to how to invest it.
9-30-2013 Latest Post on Gold:
Market Timing Gold and Interest Rates
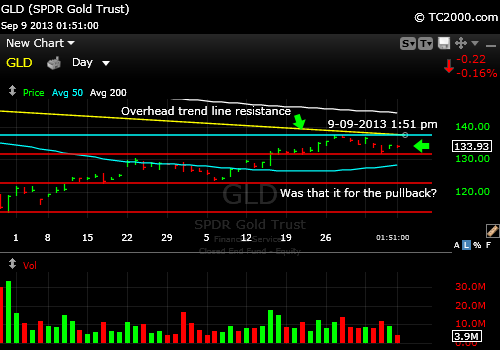
9-09-2013 Update:GLD Pullback Looks OK So Far
In my opinion, if you buy it here, you have to protect your profits around the overhead resistance if the move fails there. Then you would add more on the second breakout above resistance. Find a plan that works for you and preserve profits in any case.
And would you please "Like" the chart above by clicking the "Like" button? Thanks very much!
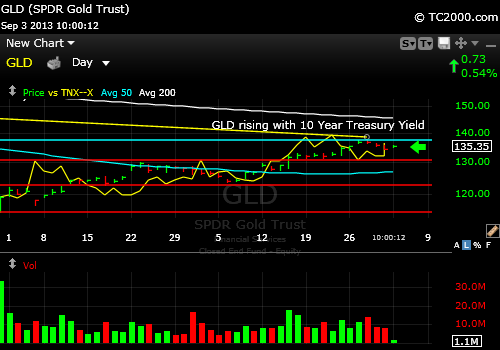
9-03-2013 Update: GLD has been Rising with Interest Rates :
The correlation has changed. I've plotted GLD vs. the 10 Year Treasury yield (yellow line) since the GLD low 6-28-2013. Previously GLD fell as rates rose. Lately gold buyers have been showing up as emerging market currencies have fallen along with the U.S. dollar.
Now that the dollar is bouncing, gold has a headwind at least in the absence of "financial market panic," which has in the past driven gold and the USD up together. More on gold in this month's free issue (out this past Monday night; subscribe at top right). And here is the chart on the latest dip in gold...
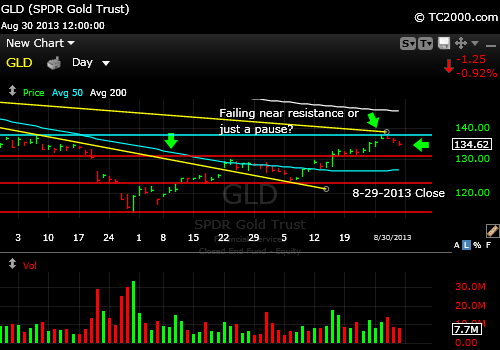
GLD Chart Update for the close of 8-29-2013:
And would you please "Like" the chart by clicking the "Like" button above? Thanks very much!
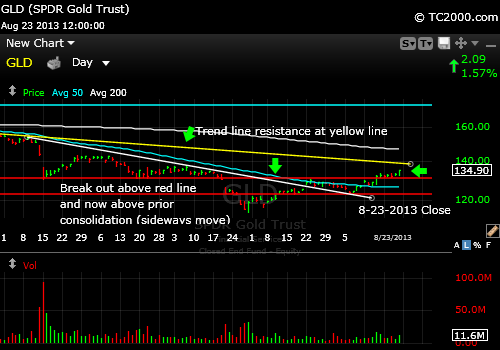
Here's the GLD Chart Update for the close of 8-23-2013:
And would you please "Like" the chart below by clicking the "Like" button above? Thanks very much!
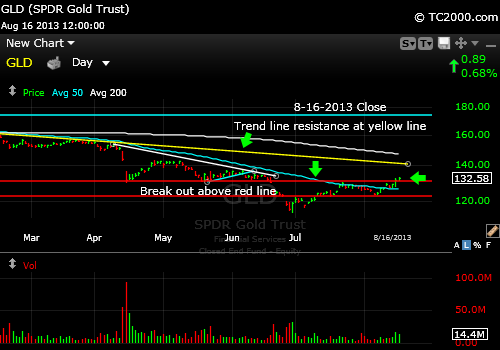
Here's the GLD Chart Update for the close of 8-16-2013:
GLD has broken out above the 50 day moving average and the red line shown, which was strong resistance, but it must now maintain the gains. There is trend line resistance (yellow) and the 200 day moving average (white) to contend with just above, but for now, it's a buy. Watch carefully because both GLD and GDX may retest their breakout points. They've run up a bit fast. Can't guarantee a pullback, but I favor one. A failure at those breakout points would not be taken well. And have a look at the TNX chart on the home page. It's the major risk to GLD and GDX. If rates rise too rapidly in the absence of excessive inflation, GLD will come tumbling down with the economy. Business expansion is easiest in a time of falling, not rising rates.
And would you please "Like" the chart below by clicking the "Like" button just above? Thanks very much!
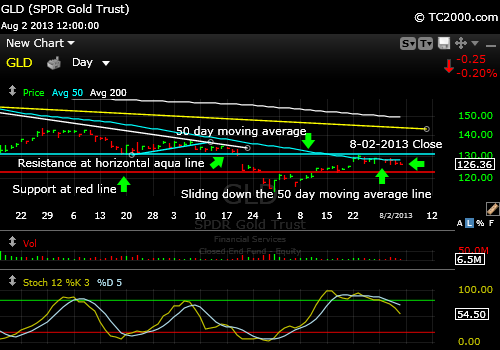
8-02-2013
Here's the GLD Chart Update for the close of 8-02-2013:
And would you please "Like" the chart above by clicking the "Like" button? Thanks very much!
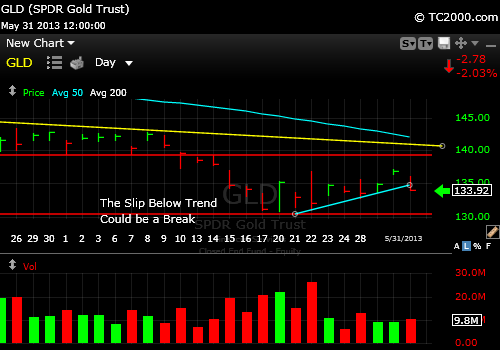
Gold has retested successfully and is in a weak bounce. All details are in the free monthly report. You can sign up to the right.
GLD 5-31-2013 Close
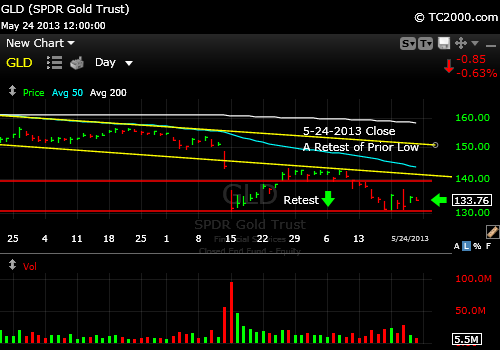
5-24-2013 Close: Gold Retests
Gold has retested successfully and is attempting a bounce. Breaking down below the recent low would cause a lot of further damage if it were to happen. If you add near here, please consider using a stop. More in the free report. You can sign up to the right.
GLD 5-24-2013 Close
And would you please "Like" the chart by clicking the "Like" button above? Thanks very much!
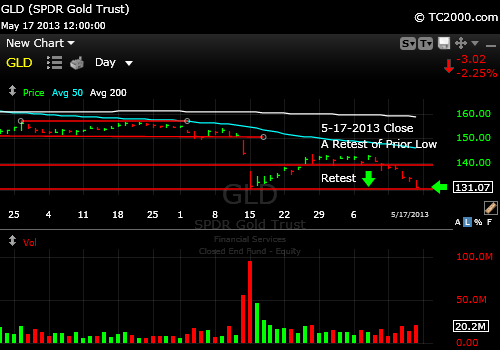
5-17-2013 Close: Gold Retests
The prior low is now being retested. It must hold or expect another chunk of value to be erased at least until the Central Banking party goes awry. Then gold will have a last hurrah.
GLD 5-17-2013 Close
And would you please "Like" the chart above by clicking the "Like" button? Thanks very much!
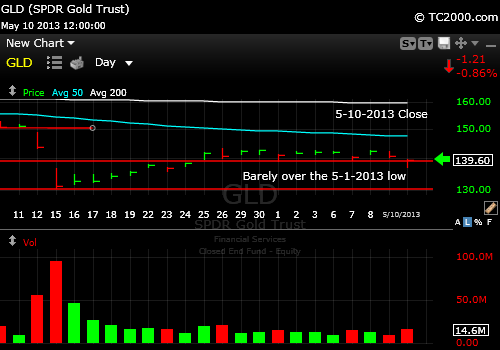
5-10-2013 Close: Gold Has Held Support - So Far!
Gold is still in consolidation as the chart shows (all discussion is in my free newsletter this week; sign up to the right):
GLD 5-10-2013 Close
And would you please "Like" the chart by clicking the "Like" button above? Thanks very much!
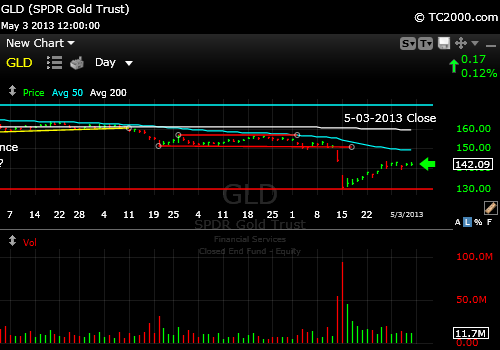
5-03-2013 Close: Gold Just Hanging On
Gold spent the week in consolidation (going sideways). The employment numbers were good and gold held steady which is a positive. There was also a swoon on Wednesday after the Fed minutes, but GLD recovered. The recovery was only about 50% of the prior drop, which is typical of bounces following sharp drops. Gold is not out of the woods yet. Respect the direction of the market and watch your stops.
GLD 5-03-2013 Close
And would you please "Like" the chart above by clicking the "Like" button? Thanks very much!
As always, it's your money and your decision as to how to invest it.
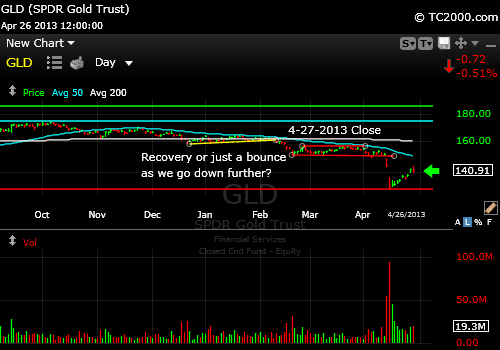
4-26-2013 Close: The Now Bouncing Golden Knife
This week you can read all my comments on gold in my free report out each weekend the night before the market reopens. Click the button on the blue bar to the top left to sign up.
GLD 4-26-2013 Close
As always, it's your money and your decision as to how to invest it.
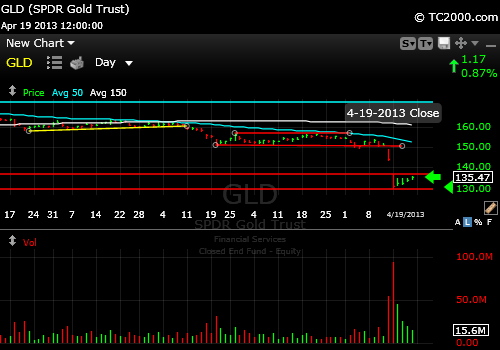
4-20-2013 Close: The Falling Golden Knife
Gold broke support last week. I advised investors to exit according to their own choice of stops. Some did, others didn't. GLD was down another 5.9% after a bit of a bounce through the end of the week. On Monday it looked much worse. Is that it? If you think anyone knows, think again.
Gold has no inherent value beyond the MARGINAL cost of production (cost of mining the most expensive ounce that can be sold), which per CNBC's recent article is estimated at $1200 per ounce ( Gold Cost of Production). Then add a premium for distribution of 10% to be very conservative which brings us to $1320 vs. current spot price of $1406.50. Often there is an overshoot below the "value" of a financial asset, and realizing this is a crude estimate, that could bring us to say 10% below the production cost or $1080. So perhaps we should consider buying in the range of $1000-1300/ounce. What do you think? Tweet me your thoughts on Twitter here: @SunAndStormInv GLD 4-19-2013 Close
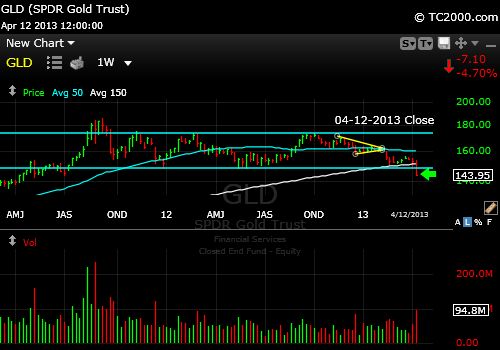
4-12-2013 Close: Gold ETF Breaks 2011 and 2012 Support
GLD broke through some important support on Friday as commodities slid with it. See this week's free newsletter for further details. Sign up in the box to the right.
GLD ETF 4-12-2013 Close
And would you please "Like" the chart above by clicking the "Like" button? Thanks very much!
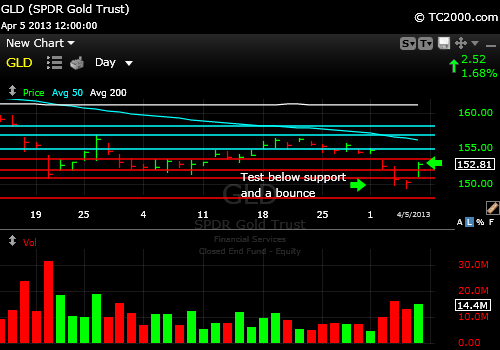
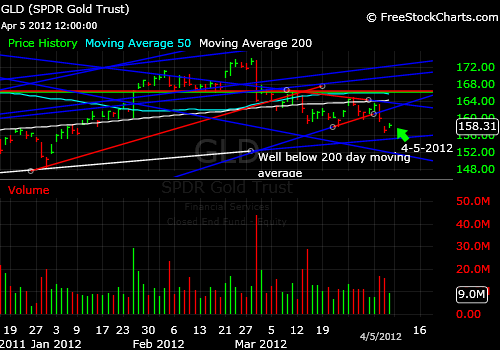
Gold broke some recent support this week and then recovered back above it in a reversal. That was a buy point for those who have little or no gold exposure with a stop below the 2012 low if you want a slightly wider stop or below nearby support (red lines on chart) if you want one that is closer by.
GLD ETF 4-05-2013 Close
And would you please "Like" the chart below by clicking the "Like" button above? Thanks very much!
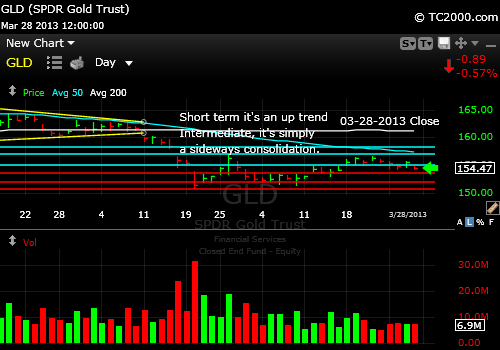
3-28-2013 Close: GLD ETF (Gold ETF) Now In a Range
The GLD ETF hit resistance near 156.80 and dropped. It's now in a defined range. We'll follow it above or below that range on Twitter between these reports, so stay tuned. Every time the world looks like it could fall apart again, some entity comes up with a few billion dollars to save the day. Gold drooped down after the Cyprus fiasco was taken care of by penalizing the bank holdings of rich Russians.
The freedom to invest above the guarantees our governments place on the banks is more under scrutiny this weekend by the world's richest people. For more, subscribe to the free newsletter in the box to the upper right (out by 9 pm this Sunday evening ET at the latest).
As always, it's your money and your decision as to how to invest it.
The GLD ETF finally may move up. The GDX gold miners are supportive of such a move. For more, subscribe to the free newsletter (see blue bar to left).
And would you please "Like" the chart above by clicking the "Like" button?
Thanks very much.
As always, it's your money and your decision as to how to invest it.
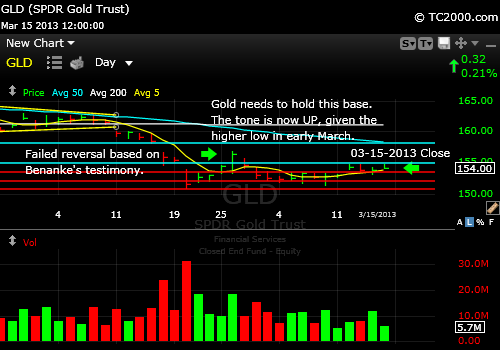
Gold has formed a strong base. There is a higher low on the daily chart now. Note the February low and then the higher low above that set in early March. The price has risen above the consolidation range (sideways move) of the first part of March. See the new slightly higher level achieved above the upper price range in early March?
It is a true fledgling up trend that could be stomped away in a flash by an overeager central banker yapping to the press. I'd recommend using a stop below the March low for new positions if you have no gold exposure or not enough.
Buying lows in the GLD ETF is not easy, because the nature of a long correction, which is likely what this is, is to move down, then up and sideways, then down again to a brand new low. This in fact is the SEVENTH rally since the prior high back in October all occurring within a decline. You can see that pattern in the chart from last week that is shown below (second chart down). It's like a downward stairway where each step is angled up.
As always, it's your money and your decision as to how to invest it.
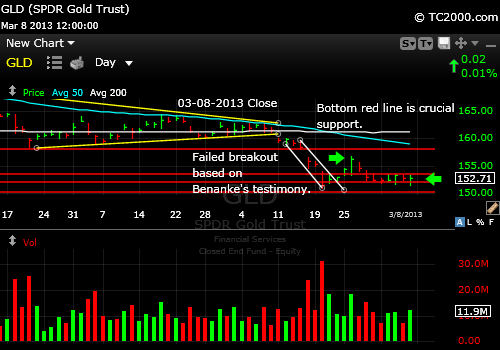
3-08-2013 Close: Gold Hanging On
GLD is hanging on above the second level of support from the bottom. Well, it could be worse. Gold could be breaking to new lows as gold mining stocks have been doing.
GDX (gold miner ETF) attempted a reversal above the 5-16-2012 low on 2-26-2013, and it failed. There was also an attempt to rally back above the 2-20-2013 low and that failed as well.
Gold stocks are at very low valuations compared to the price of gold, so one of two things will now happen. Gold will crash through the 2012 lows and bring far greater losses to the miners, or the GDX (HUI) will pull off a successful reversal soon above the two prior lows mentioned. I explain in my free report out today why gold will likely hold the current low for now.
As always, it's your money and your decision as to how to invest it.
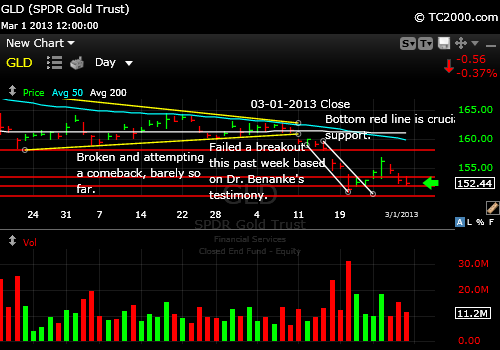
3-01-2013 Close: Gold Is Still Weak
Gold attempted a breakout based on Fed Chair Bernanke's testimony, but it fell apart. Gold is back down testing previous support levels that have already been tested once. They must hold or there will be far more damage to gold and of course to gold mining stocks as well. Check out my free newsletter to find out what commodities have just signaled (check the long term signal which was just updated in the newsletter).
As always, it's your money and your decision as to how to invest it.
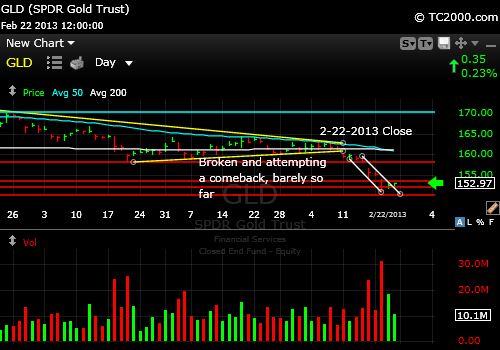
2-22-2013 Close: Gold Falls to Lower Support After a Cascading Fall
Gold is down and has simply bounced in a downtrend channel as the chart below shows. The last three days only amounts to a consolidation (sideways move). We need a breakout above that lower channel (the one angled down and to the right) before any buying can be considered. Otherwise the 2012 lows will be revisited or broken. My guess is that initially at least, the 2012 low will hold, but that does mean a further decline in gold and gold stocks, before a more significant bounce. If there is a move up from here, the first interesting sign of strength would be a rise above 153.41. I'll be tweeting about gold this week I'm guessing!
As always, it's your money and your decision as to how to invest it.
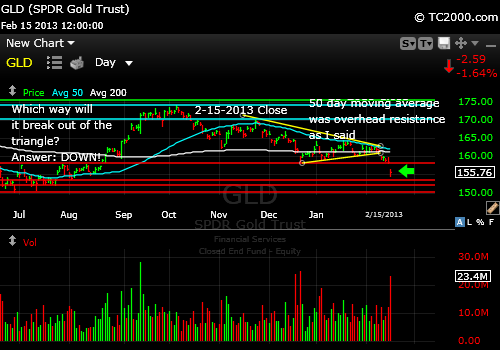
2-15-2013 Close: GLD Has Chosen a Direction
GLD has broken the triangle I pointed out on the chart last week to the downside. It was a trading SELL when it did. The breakdown means there is likely more downside to go at least to the 12-30-2011 or the 5-29-2012 low. This will probably drag the mining stocks down as well of course.
Check out the chart of the 10 Year Treasury on the homepage. If rates do shoot up to 2.4% as I believe they may, the price of gold could suffer further due to the belief that real interest rates will be rising again. Gold does best with negative real interest rates as I've discussed. If rates rise above the rate of inflation, gold will be pummeled.
As always, it's your money and your decision as to how to invest it.
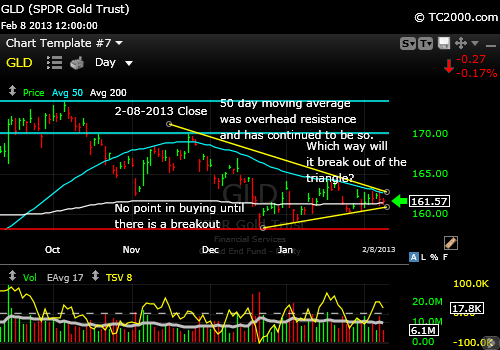
2-08-2012 Close: GLD Is Biding Time
GLD has been stagnant for the past week, bobbing up and down. Waiting for more strength is the best plan if you are thinking of adding to your position. See last week's post below to find out where to buy. The first buy would now be at 162.96. Note the triangle formed by the yellow trend lines. The direction of the break out from that triangle will likely provoke a strong reaction in the same direction.
The monetary climate would tend to favor gold moving up. But the lack of fear in the markets is holding gold back. Seeing the GLD ETF breaking down again at this point would be very bearish. I am not favoring it will, but will be watching. What we "think" a market should do does not matter nearly as much as what it does.
As always, it's your money and your decision as to how to invest it.
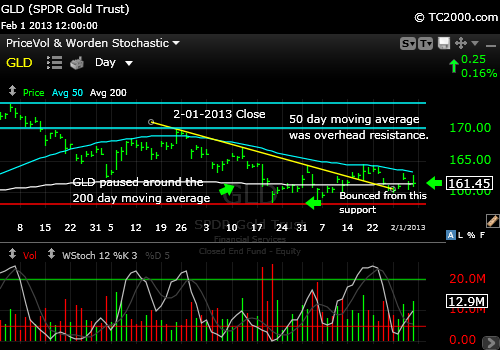
2-01-2013 Close: The GLD ETF Is Holding Up Below Resistance
The GLD ETF has been holding up below the 50 day moving average but above the 1-28-2013 low, which created a higher low above the prior two daily lows. GLD is now above the yellow down trend line shown in the chart below The first hurdle will be scaling the 50 day moving average and then the highs of 1-2 and 1-17. Rising above both of those highs will signal a true trend change in my opinion. If you want to take a conservative approach to adding to a trading gold position, wait to buy until all three of those hurdles are overcome.
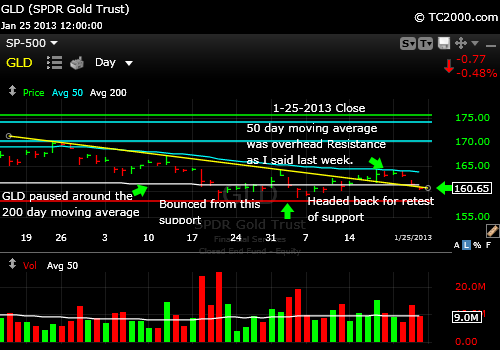
01-25-2013 Close: GLD Is Weakening Again
GLD is now almost exactly back at the yellow down trend line and has been repelled downward by the 50 day moving average as the chart below shows. It will have to seek support at the prior Jan. or Dec 2012 low.
Please subscribe to the free newsletter using the box to the upper right for more discussion of gold, if you have not done so already.
As always, it's your money and your decision as to how to invest it.
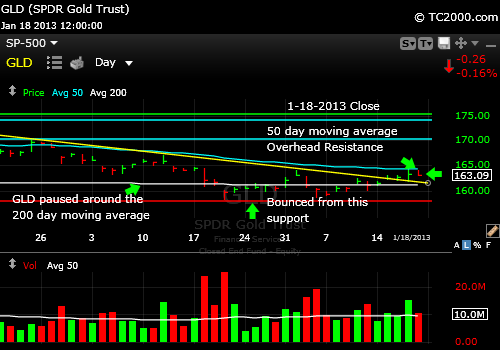
01-18-2013 Close: GLD Is Now Above the Recent Downtrend Line
GLD is now just above the yellow down trend line (see chart below) that has contained its advance since the end of November 2012. What it faces now is resistance at the 50 day moving average. It bounced down from that line on Thursday, but it has not yet fallen back below the yellow down trend line, which is positive.
This long correction has been trying the patience of gold and gold stock investors. I just published a new page (see blue bar to left) on the gold miner chart (HUI, GDX). Take a look at the charts there. There is finally some hope for gold stocks although the HUI gold stock index closed below the mid November high and above the early December high on Friday. Closing above both of those lows would have been better. I always follow HUI and GDX along with GLD. It's important that they are moving up together to sustain a rally.
CONCLUSION: If you buy at this level of the GLD ETF, use a stop and consider adding when we've scaled the 50 day moving average.
As always, it's your money and your decision as to how to invest it.
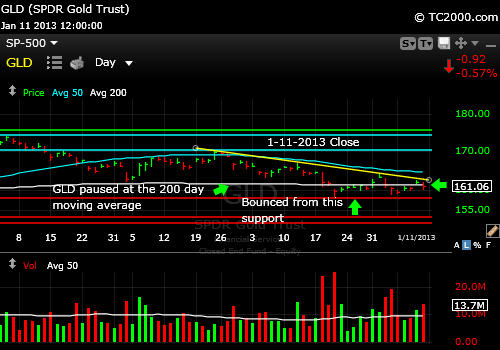
01-11-2013 Close: The GLD ETF Pushed Back from Downtrend Line Again
The GLD ETF has fallen back to the downtrend line shown in yellow on the chart below. It fell a second day and looks headed back to retest the red line shown just below the current price in the chart. That support must hold.
The fact that central banks worldwide are still printing money madly, while gold is having difficulty getting up through the nearest resistance is not positive needless to say. It raises the question as to whether there is something fundamentally different going on. Is the world economy finally healing from the 2008-2009 fiscal crisis or not? If not, gold should resume its trend and at least match the prior high if not exceed it, but if so, gold will break down even through the 2012 lows. The Bonus chart of the week (see homepage) tells you why it is more likely that gold will have its day in the sun again.
And would you please "Like" the chart above by clicking the "Like" button? Thanks very much.
As always, it's your money and your decision as to how to invest it.
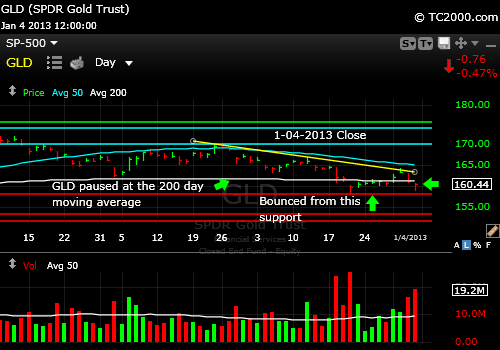
01-04-2013 Close: GLD Bouncing from Lowest Support Above 2012 Lows
Gold fell back from the yellow downtrend line seen on the chart below. It then fell beneath the 200 day moving average and bounced from some support found at the highs of summer 2012. The first possible buying point would be a rise up through the 200 day moving average. Then the 11-02-2012 low of 162.30 comes into play followed by the 1-02-2013 high. Then the 50 day moving average will be the next breakout target. A clean break up through that would make 11-23-2012 high the next upside target. The yellow downtrend may stop GLD, but that would be a sign of technical strength if it doesn't.
Please subscribe to the free newsletter using the box to the upper right for more discussion of gold, if you have not done so already.
And would you please take a moment and "Like" the chart by clicking the "Like" button above.
As always, it's your money and your decision as to how to invest it.
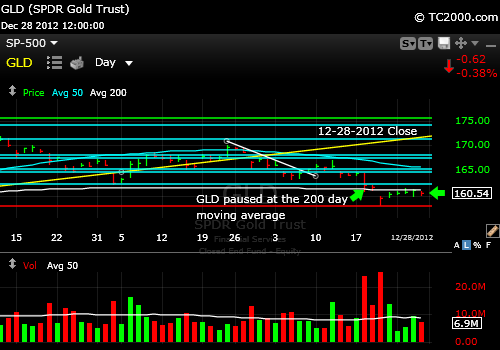
12-28-2012 Close: Gold Is Not Yet a Buy
The GLD ETF broke through critical support last week GLD must now break above the first overlying aqua line of resistance to become a buy (see chart below). Moving above that line would represent a reversal. If such a reversal occurs next week, a stop could be set just below the line just in case the move turns out to be a fake-out.
And please don't forget to "Like" the chart above by clicking the "Like" button? Thanks very much.
As always, it's your money and your decision as to how to invest it.
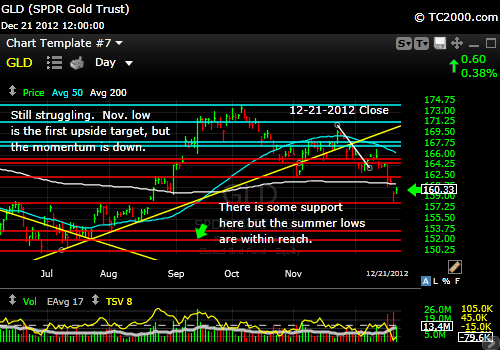
12-21-2012 Close: Gold Has Broken Important Support
The GLD ETF broke through the support we've been following the past few weeks. Metal investors were hoping that the Fed's actions would stimulate even more bullishness among gold buyers, but it did not. There is a shift going on from Europanic to the belief that the U.S. is even more out of control of its fiscal story. The economy is OK, not diving yet, although there are those who claim the fiscal cliff could bring us to our economic knees. So Eurostabiity translates into less money for gold and generally more for Euros. Given the longer term alliegance of countries around the world, now including Japan's new leadership, to money printing, gold's days are not likely numbered. I'd say for now, there is a "Europause" happening. The chart below indicates more pain for gold investors before support is found.
As always, it's your money and your decision as to how to invest it.
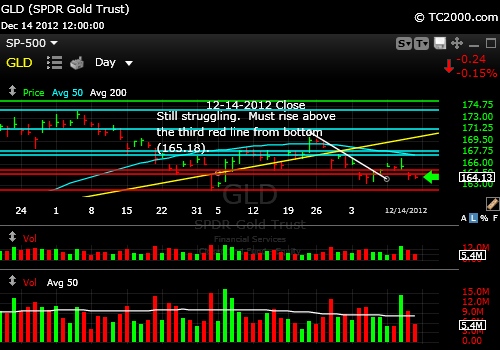
12-14-2012 Close: Gold is Hanging On
Gold is still seeking support along with silver. (I'll publish a chart comparing silver and gold early on Monday on the blog page.) The GLD ETF rallied from a higher low earlier in December but now is pulling back to at least test the higher low. A market timing move above the 3rd red line from the bottom would be the minimum for the first trading buy. But it's not really worth adding to positions on an intermediate term basis until the GLD ETF scales the 50 day moving average. A minimal rise above it would not be enough for a buy. The price will likely have to be above the lower aqua line on the chart to provide convincing strength.
You see, the issue with declines is that they are never straight down. There are rallies back UP along the way that confound the shorts and the new born Bulls. The retests often shake out the fresh Bulls especially when retests go below the prior low.
This part of the trading is not a conspiracy as some think. Yes, market makers can move stocks in slow periods with small purchases in a relatively illiquid stock or ETF. But those who buy at prior bottoms often make their stops too tight and are shaken out. That fits the "penny wise and dollar foolish" model of investing. Don't do fall for that trap. If your risk tolerance is zero, you will find it hard to make money in the markets, because of the noise that commonly occurs. Don't trade the noise.
Please subscribe to the free newsletter using the box to the upper right, if you have not done so already.
As always, it's your money and your decision as to how to invest it.
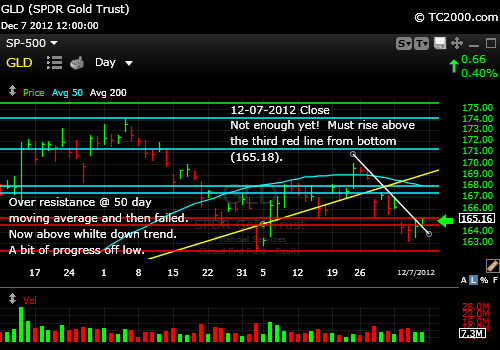
GLD ETF Market Timing Chart for 12-07-2012 Close:
The GLD gold ETF has now failed at the top curved aqua line, the 50 day moving average, but is bouncing from what could form as a higher low. Note the move above the white down trend line on the chart. That is the first step up. The second step is to rise above the red line just above the green arrow on the right. Then the minimum upside target would be one of the aqua horizontal lines above it. We'll then run up against the 50 day moving average again, where it previously failed. A rise above there will allow for a further healthy rally.
It is your money and your decision as to how to invest it. Follow me on Twitter to hear of my trades much sooner.
Please subscribe to the free newsletter using the box to the upper right, if you have not done so already.
As always, it's your money and your decision as to how to invest it.
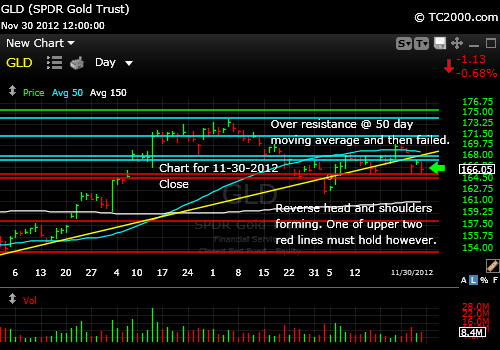
GLD ETF Market Timing Chart for 11-30-2012 Close:
The GLD gold ETF has now failed at the top curved aqua line, the 50 day moving average. So we'll have to now hold the top red support line or we could retest the prior low near the 200 day moving average. Dollar strength that was building is now waning a bit, but still could cut either way. Any further weakness will help both stocks and gold to rally.
It is your money and your decision as to how to invest it. Follow me on Twitter to hear of my trades much sooner.
Please subscribe to the free newsletter using the box to the upper right, if you have not done so already.
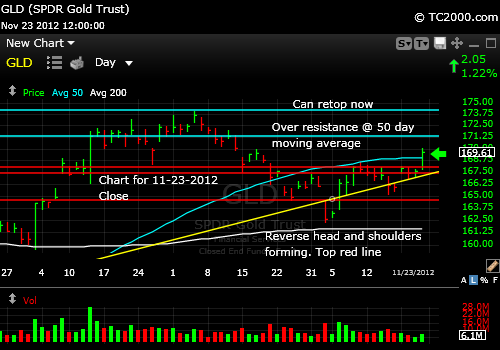
GLD ETF Market Timing Chart for 11-23-2012 Close:
The GLD gold ETF has developed some strength lifting above the 11-09-2012 high and up through the 50 day moving average. It has also broken a rough reverse head and shoulders pattern with the head located at the 11-02-2012 low, which makes the target the prior high of 174.07 at a minimum, which means re-topping.
It is your money and your decision as to how to invest it.
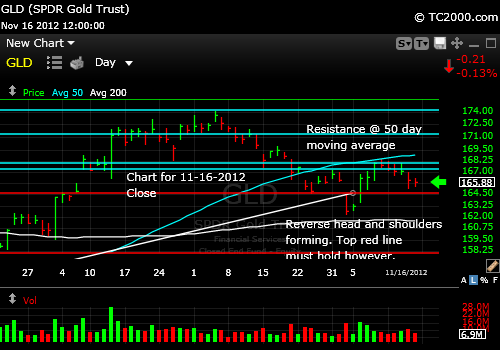
GLD ETF Market Timing Chart for 11-16-2012 Close:
The GLD gold ETF has been pulling back a bit based in part on US dollar strength. It in fact pulled off the 50 day moving average and fell a bit.
The good news is that GLD ETF is now forming a reverse head and shoulders. The left shoulder is the Oct. low and the head is the Nov. low. We are now attempting to find a right shoulder. If that level does not hold, we'll drop at least to the Nov. low. The positive is that the last high was a higher high, whereas if you look at the Feb. 2012 pullback, you'll see there were lower highs all of the way down to the May bottom. This means we now have comparatively more upward tone in the gold market.
I'll tell you one reason gold is not at $3000/oz and the GLD ETF is not at 290. Professional investors don't invest their clients money in it that often. I am talking about the more traditional firms here, not hedge funds. Until their clients demand some gold exposure, they just don't offer it to them. They claim they don't know what gold is truly worth. They are partly right. It's worth what people declare it's worth, but to be truthful, they'd have to admit that they don't know exactly what stocks are worth either.
Gold has had huge market timing swings over the span of time and taken many years to recover from the swoons. I bought first in the high 300's and watched the recovery after the tech bust and doubled my position when it was again in the high 300's. I had previously called a breakout in the low 300's and hesitated until I felt the trend was solid. This huge rally followed a period when the Hollywood elite were shorting gold with their investment advisors as it dropped to around $250/oz. Yup, that there is a market timing buy signal! When Barbra Streisand was day trading EBay's stock, you knew it was almost over. (Nothing against her by the way. Just a good example of someone who started doing something simply because it was in vogue.) When Hollywood stars were shorting gold, you knew gold was almost done with its decline.
What have they been buying most of in Hollywood right now? My guess is bonds, which according to the sage of Omaha, Warren Buffett, are vastly overvalued!
If you can afford to simply hold gold "no matter what," that is likely to be the best approach for some time to come. As I've mentioned, on a trading level, gold will decline significantly the moment real interest rates start to rise again in earnest.
It is your money and your decision as to how to invest it. Follow me on Twitter to hear of my trades as they happen.
Please subscribe to the free newsletter using the box to the upper right, if you have not done so already.
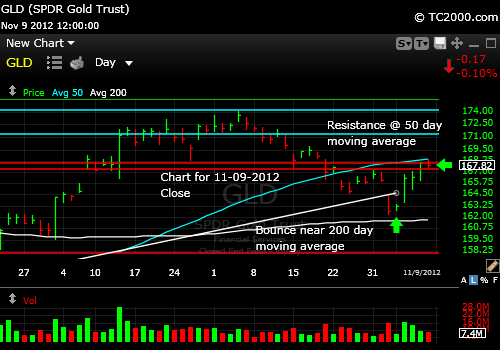
GLD ETF Market Timing Chart for 11-09-2012 Close:
The GLD gold ETF started a rally on the day of the US elections and that has continued from there. It is now up against the 50 day moving average and must move over there to be a buy again. I favor that the rally continues given the backdrop of monetary policy that is extremely loose!
Please subscribe to the free newsletter using the box to the upper right, if you have not done so already.
As always, it's your money and your decision as to how to invest it. Follow me on Twitter to see my trades.
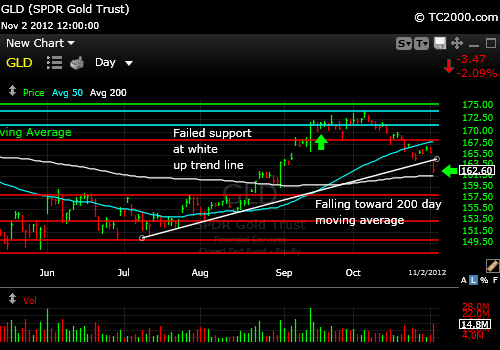
GLD ETF Market Timing Chart for 11-02-2012 Close: GLD flopped this week. It failed to hold the white daily up trend line shown in the chart below. Now the 200 day moving average comes into play. The vague thought is that the economy is truly getting stronger and for that reason, the Fed will step back and allow interest rates to rise modestly and thereby create positive real interest rates above inflation. That would bring gold down. The correction is probably not quite over though I'm expecting some sort of bounce as detailed in my free newsletter this week.
It is your money and your decision as to how to invest it.
Please subscribe to the free newsletter using the box to the upper right, if you have not done so already.
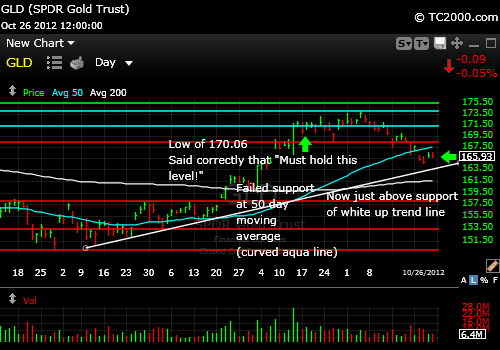
GLD ETF Market Timing Chart for 10-26-2012 Close: GLD has fallen through the 50 day moving average. Now it may fall to either the white up trend line or the 200 day moving average next. That would wipe out the ECB gold bounce now that the Bernanke bounce has been completely wiped out.
As always, it's your money and your decision as to how to invest it.
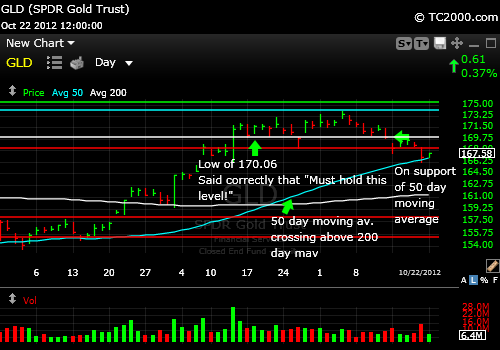
GLD ETF Market Timing Chart for 10-22-2012 Close: Gold has fallen through the red line support shown on the chart, but may find some relief at the 50 day moving average. If not, it will fall to the 200 day moving average next. That would wipe out the ECB gold bounce now that the Bernanke bounce has been completely washed away.
It is your money and your decision as to how to invest it.
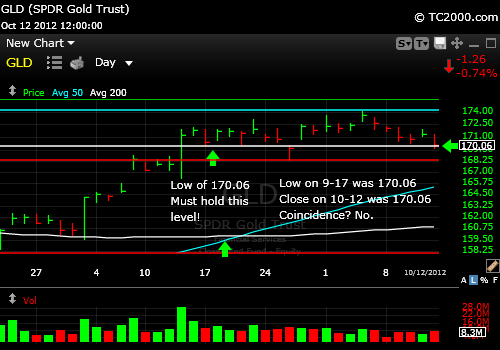
GLD ETF Market Timing Chart for 10-12-2012 Close: GLD is now sitting precisely on the intraday low of 9-17-2012. This is the last thread of support above the 9-26-2012. Then the 50 day moving average comes into play. Given the fact that world leaders are hell bent upon the degradation of all of their currencies, one of these support levels is likely to hold. I am out of my trading position for now and holding my long term position.
So what do you do?
1. One tactic would be to rebuy a starting position at this or the next support and ditch it X% below the given support level.
2. Another approach IF you believe the long term trend will take us to $2000 per ounce and beyond is to add at each support level and then build the trading position as we move up. If one support level gives way, you would add again at the next lower level of support and add further to your position upon the resumption of the up trend.
3. You could wait for either a) a new high above the bright green line in the chart or b) a significant discount to current prices, which at this point would be the area at or just below the 200 day moving average on the chart below. This approach would say that guessing what the gold ETF will do in between the green line at the top and the lower support levels is too difficult. Every burp at dinner by a central banker can move the price of gold by 5% up or down.
It is your money and your decision as to how to invest it.
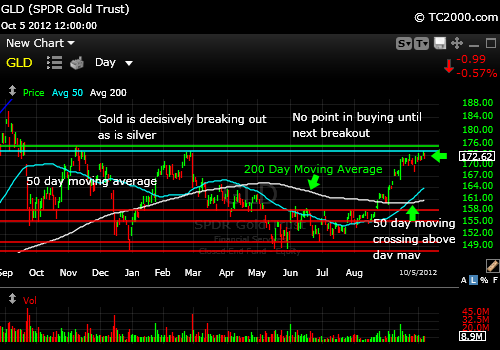
GLD ETF Market Timing Chart for 10-05-2012 Close: Gold is right up against resistance and has yet to make it through.
I will be adding to my current trading position at the time of the next breakout. I gave details about my gold ETF long term hold position and short term trading position in my free newsletter last week. That is where I reveal my best ideas with my current Buys, Sells and Holds. At any rate, the close on Friday was still OK, because it is above 172.23, which was the prior breakout above the 9-14-2012 high.
We are also above the 5 day moving average which is a good indicator of very short term trading direction. The GLD gold ETF may drop below it for 1-3 days, but that is about it when there is a strong up trend in place. The tone is UP. Follow me on Twitter to hear of my trades as they happen.
I will exit this trade if it falls apart. The pro's are betting against gold at the moment, which explains the hesitation in the chart below. The break in the US dollar index last Thursday and Friday explains gold's attempt to break out on Thursday. But it did not hold.
We'll remain nimble with our trading position and hold our long position for now. As long as the Fed keeps real interest rates negative, gold will do fine.
As always, it's your money and your decision as to how to invest it.
GLD ETF Market Timing Chart for 09-28-2012 Close The dollar could break out to new recent highs on Monday. If it does, gold will be under immediate pressure. Gold is not worth buying until it goes to a new recent high. The big fall on 9-26-2012 suggests that GLD will correct before staging the next rally. Would you please like this page below if you have not yet done so? Thank you for the reciprocity and support!
As always, it's your money and your decision as to how to invest it.
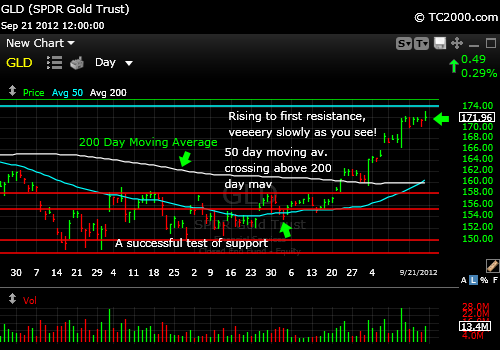
GLD ETF Market Timing Chart for 09-21-2012 Close Although gold has performed well for us lately, this week the dollar looks like it is itching to rally as discussed in my free newsletter. That will make it tougher on gold to make headway in dollar terms. If buying picks up in non-US dollar realms, then gold could still make some progress or at least hold its value. The two resistance levels on the chart below are still awaiting gold and need to be overcome for gold to re-top at the old highs.
As always, it's your money and your decision as to how to invest it.
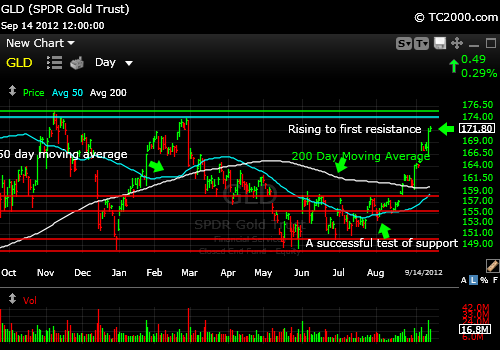
GLD ETF Market Timing Chart for 09-14-2012 Close Gold has made us plenty of money over the past few weeks. The gold ETF continues to rally strongly, actually catapulting up YET again on Thursday. It has gotten two swift kicks UP by first the ECB and then the Fed this week. I suspect the first pullback will be at one of the two upcoming resistance levels, but the rally may not end so soon. You can see the two resistance levels on the chart below.
As always, it's your money and your decision as to how to invest it.
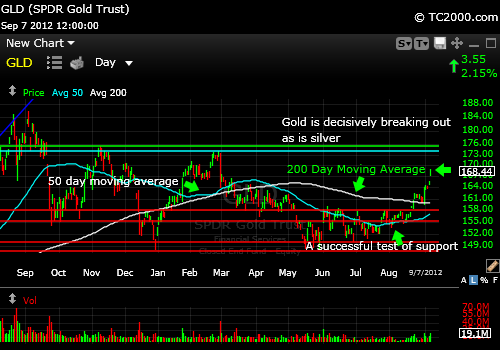
GLD ETF Market Timing Chart for 09-07-2012 Close The gold ETF continues to rally strongly, actually catapulting up on Friday. This is a major breakout and will not likely end at least until GLD reaches 174ish, if not the prior high. I was buying UP once again this week. The chart below shows you that you'll now have to buy a bit and wait to buy on each step up or down if you've been left out of this rally. If the Fed disappoints the market, risk will show up suddenly, so be reasonable in your allocation to metals despite the strong trend, unless you are very careful about using stops and not falling asleep on your holdings.
As always, it's your money and your decision as to how to invest it.
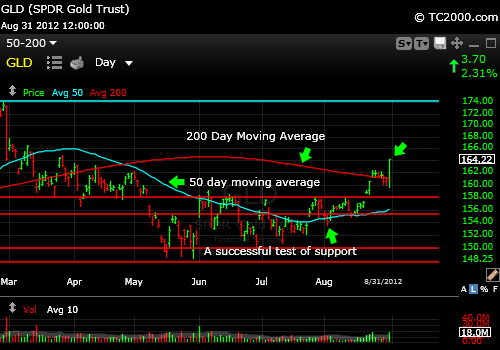
GLD ETF Market Timing Chart for 8-31-2012 close The gold ETF continues to rally strongly and pulled off a strong high volume breakout this past Friday and a monthly breakout too. I was buying UP this past week and will continue to add not just gold, but other related ETFs mentioned in this week's newsletter. Check out the chart below and...
As always, it's your money and your decision as to how to invest it.
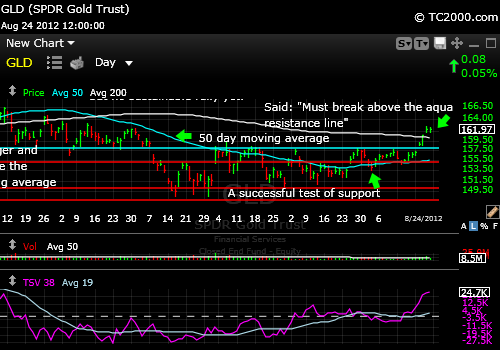
GLD ETF Market Timing Chart for 8-24-2012 close The gold ETF is in full rally mode. GLD has broken above the line connecting the 6-6-12 and 8-10-12 highs. It is also above the 200 day moving average. I will likely be buying the next breakout to average UP. Check out the chart below.
As always, it's your money and your decision as to how to invest it.
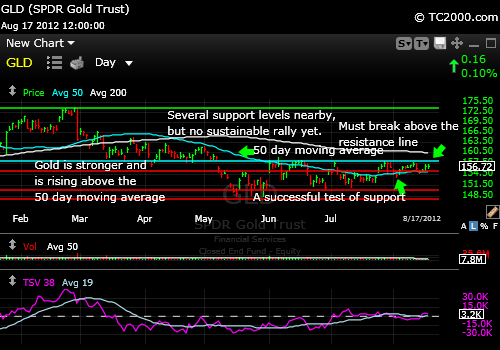
GLD ETF Market Timing Chart for 8-17-2012 close The gold ETF has pulled back from resistance at the prior summer highs, but has not "given up" yet. There is still underlying support for gold at these prices. That is clear as the chart shows below.
As always, it's your money and your decision as to how to invest it.
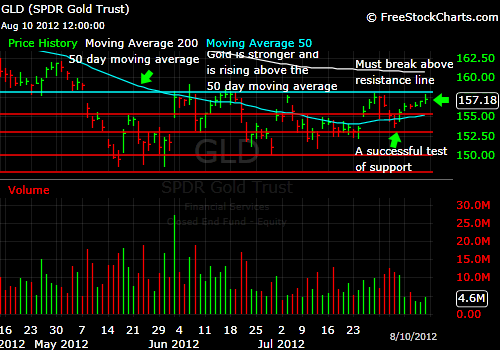
GLD ETF Market Timing Chart for 8-10-2012 close The gold ETF has stalled at resistance at the prior summer highs.
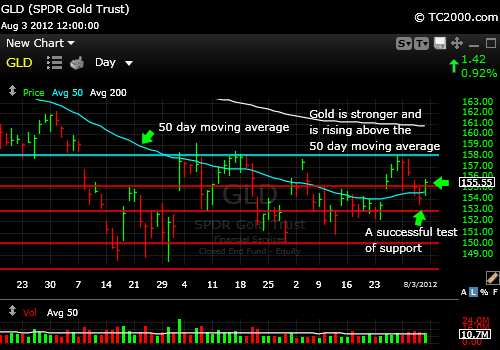
GLD ETF Market Timing Chart for 8-03-2012 close The gold ETF tested below the 50 day moving average for one day and is now above it which is positive. It is buyable here with a stop. There is resistance at the two June and July highs. Overall, gold must still prove itself, but because the chart is more of an ascending triangle than anything else (lid on top is that top aqua line along the highs), the bias is UP rather than down.
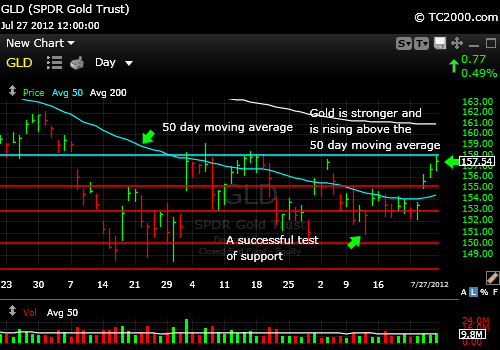
GLD ETF Market Timing Chart for 7-27-2012 close The gold ETF has now bounced and is up against resistance at the 7-03-2012 high. It then faces some resistance at the two June highs as well. Those are the next headwinds for the Bulls.
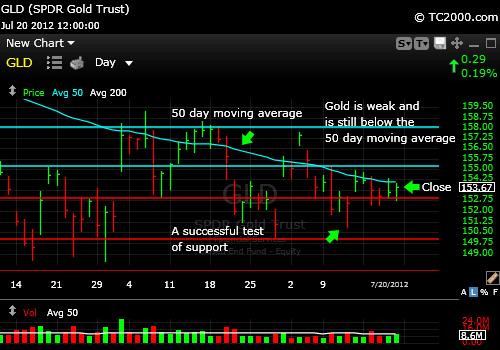
GLD ETF Market Timing Chart for 7-20-2012 close The gold ETF has survived a retest of support thus far as the chart shows below, although it failed to close above the 50 day moving average. That is the next hurdle for the Bulls. This week's action did not help gold scale the 50 day moving average.
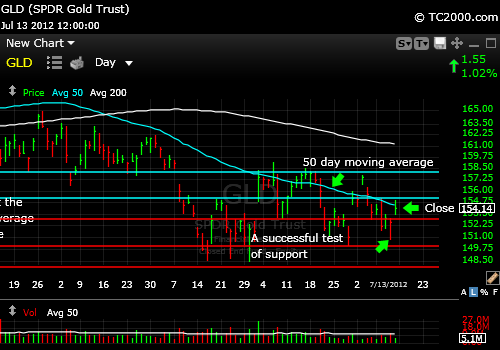
GLD ETF Market Timing Chart for 7-13-2012 close The gold ETF has survived a retest of support thus far as the chart shows below, although it failed to close above the 50 day moving average. That is the next hurdle for the Bulls.
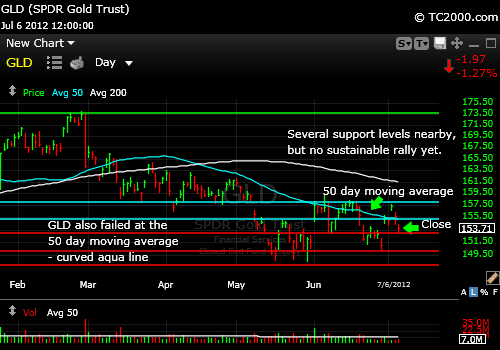
GLD ETF Market Timing Chart for 7-06-2012 close The gold ETF is sinking back to support yet again, based in part on US dollar strength. If you have not seen it, please also review the US Dollar Index chart on the homepage. US Dollar Index ETF - UUP
GLD ETF Market Timing Chart for 06-29-2012 close The gold ETF bounced vigorously after the EU summit announcements were digested and the market realized that Europe would be injecting more financial heroin into the veins of the banks of weak links in the Eurozone. And the financial status of the member nations would not suffer because they accepted the heroin. Despite recent calls for the death of the gold Bull, it seems unlikely to occur. Weakness beyond a further correction to completely scare the weak hands out of the market is about all we should see, that is, until real interest rates turn positive again.
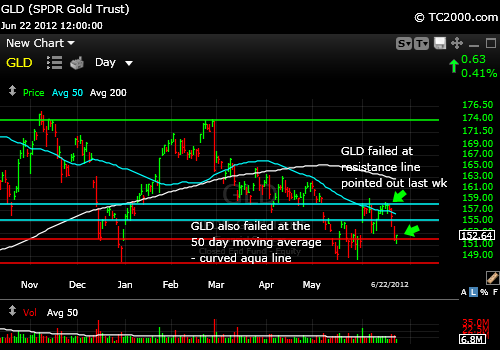
GLD ETF Market Timing Chart for 06-22-2012 close Last week I wrote: "The lowest it can comfortably fall and maintain the up trend would be the 5-18-2012 high." That level did not hold. The Fed came up with a "Twist" extension to help keep rates are down and they are already down, so the market was displeased. The economies of the world are slowing and there is no fiscal help in sight. With no QE3, Quantitative Easing 3, in sight either, the markets were unhappy last week. Please see the GLD market timing chart below and also my Homepage to catch up on the silver ETF chart (button to upper left on blue bar).
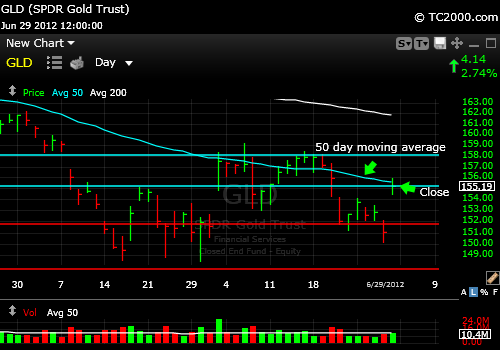
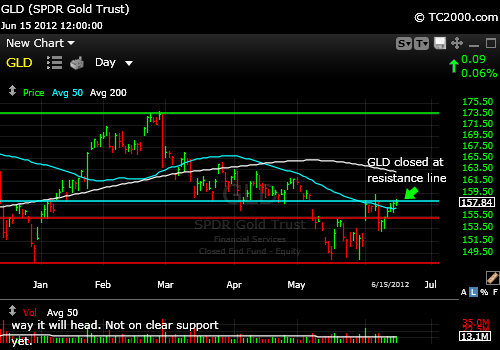
GLD ETF Market Timing Chart for 06-15-2012 close GLD has bounced and the third bounce was the charm. It has made it up through the April 2012 low but now needs to make it up through additional overhead resistance, the first of which is at the aqua line overhead, then the 6-6-2012 high and then the 200 day moving average. The lowest it can comfortably fall and maintain the up trend would be the 5-18-2012 high, but I'd rather see the 50 day moving average hold. Please see the GLD market timing chart below and also my Homepage to catch up on the silver ETF chart (button to upper left on blue bar).
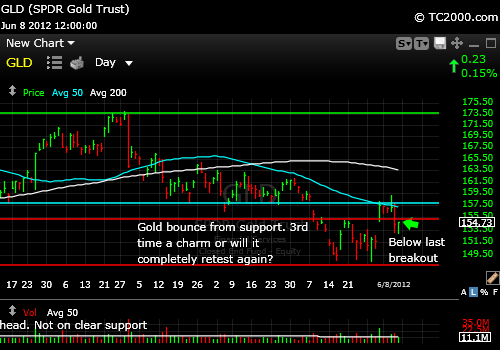
GLD ETF Market Timing Chart for 06-08-2012 close GLD is now retesting the last breakout point. It could bounce from this retest or fall to the prior low if the world's central banks fail to act further. If the prior low is taken out the damage from there could be significant. I doubt that will happen, but you need to know the possibilities to make better decisions in regard to your stop loss points. The 50 day moving average remains an overhead resistance point.
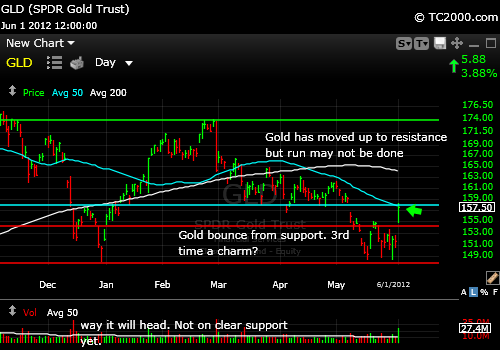
GLD ETF Market Timing Chart for 06-01-2012 close Gold finally bounced for the 3rd time and is much stronger than silver so far. Use a stop if you buy!
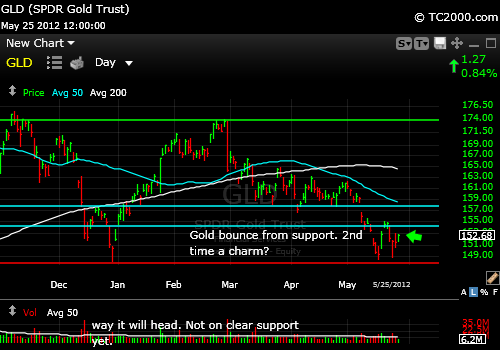
GLD ETF Market Timing Chart for 5-25-2012 close Gold finally bounced from important support, then promptly retested that same support and it now bouncing again. Use a stop if you buy!
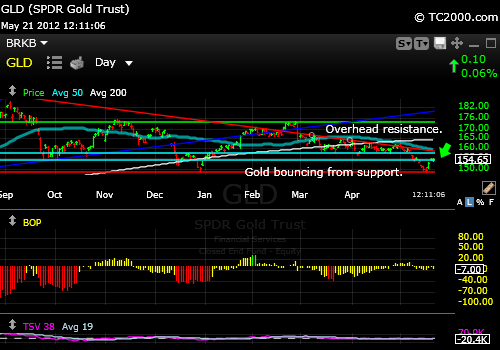
GLD ETF Market Timing Chart for 5-21-2012 12:11 p.m. Gold is now finally bouncing from important support, but use a stop if you buy.
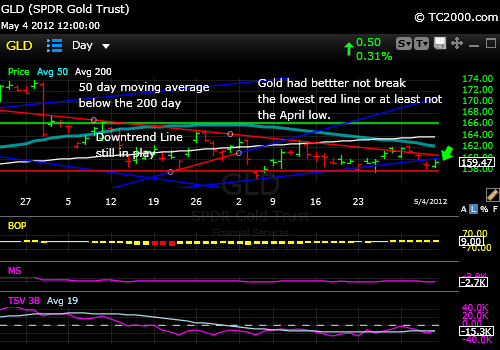
GLD ETF Market Timing Chart for 5-04-2012 Close Gold is about to declare itself in an important move. Trading against the next move won't be a good idea. If it breaks the base, it will suffer significantly more damage, at least if it goes below the April low. Moving up through that red down trend line on the chart will be a sign of strength and a buying point for Bulls.
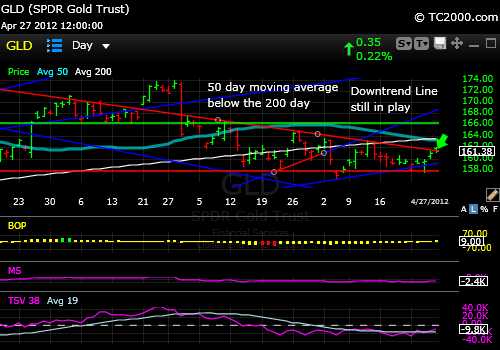
GLD ETF Market Timing Chart for 4-27-2012 Close Gold is moving up a bit but was held back by the red downtrend line on the daily chart shown below.
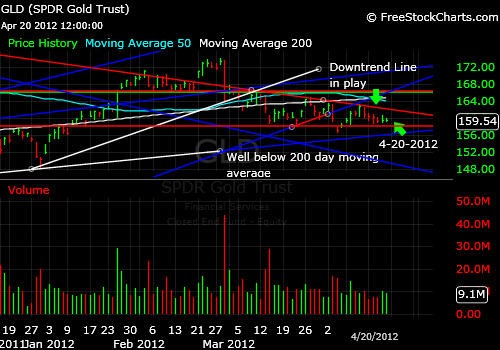
GLD ETF Market Timing Chart for 4-20-2012 Close Gold is attempting to find support at the red line in the chart.
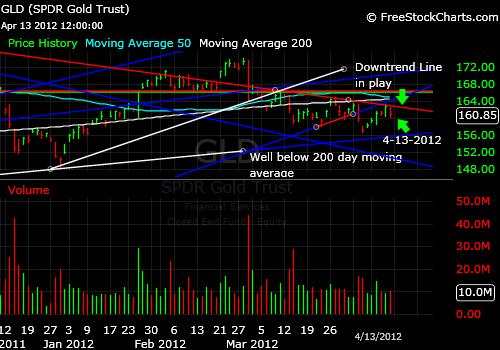
GLD ETF Chart for 4-13-2012 Close
GLD ETF Chart for 4-05-2012 Close
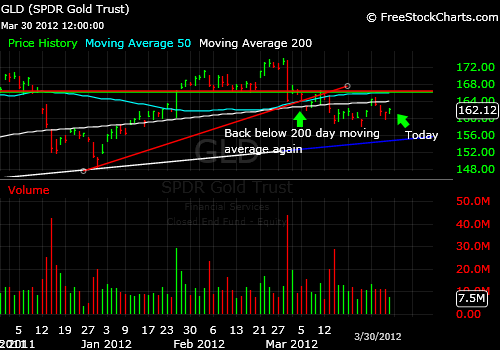
GLD ETF Chart for 3-30-2012 Close
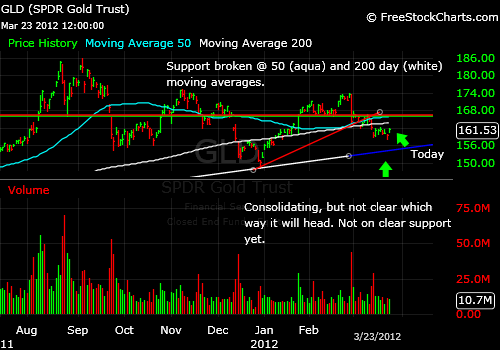
GLD ETF Chart for 3-23-2012 Close
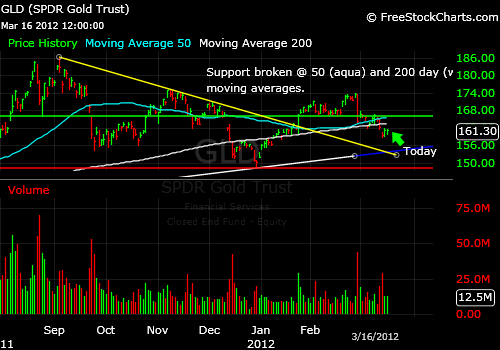
GLD ETF Chart for 3-16-2012 Close
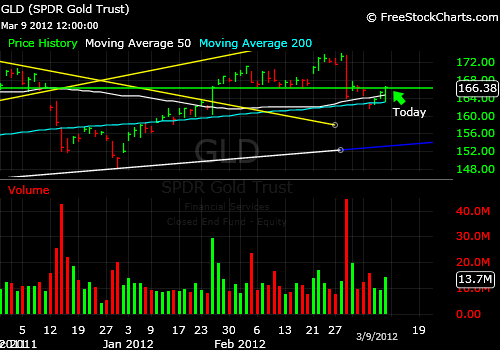
GLD ETF Chart for 3-09-2012 Close
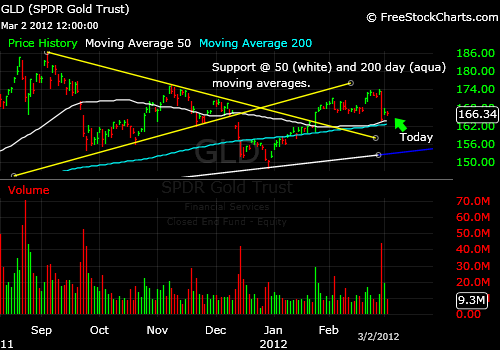
GLD ETF Chart for 3-02-2012 Close
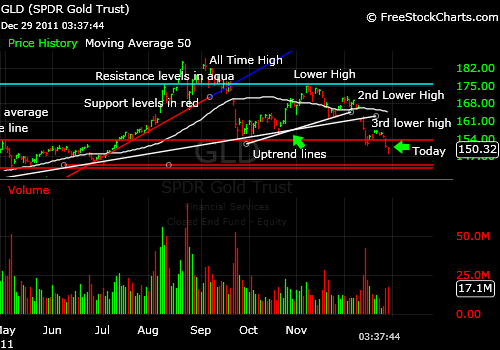
As you can see in the chart below, the GLD ETF has dropped below the 50 day moving average, having formed a series of lower highs. Then the base on 9-26-2011 was broken as well as the 12-14-2011 low. Now we wait for the bounce.
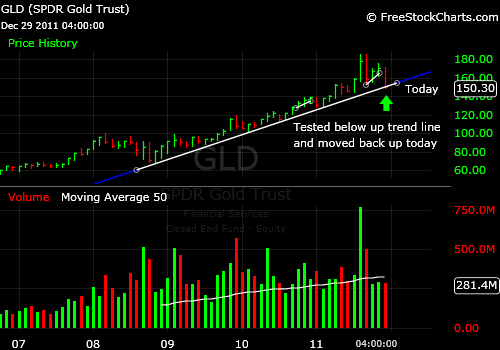
The good news is that GLD closed above a major trend line on the monthly chart (2nd chart below), so this would be a fine point to buy WITH a stop below here a percent or two - whatever you feel comfortable with should you have to take a loss and exit the trade. If you see a reversal above the prior December low, we'll have the second sign of strength and likely a reasonable rally on our hands.
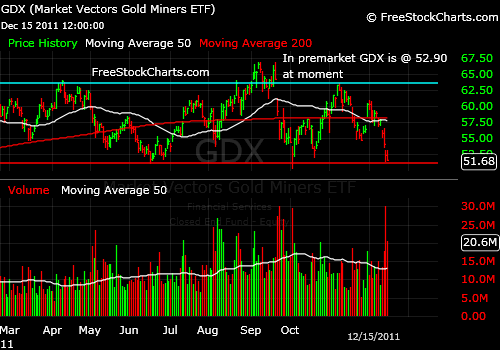
If the gold market is going to pop from this point, and it is possible that we see a reversal today, you want to buy the miners rather than gold provided that you can stand the extra volatility (see chart below). I calculated that the % return to the prior high is about 13.2% for the GLD ETF and 20.6% for the GDX gold miner ETF. Remember that the reason for this is that when gold goes up in price, the miners who were already paying for all they had to to get the yellow metal out of the ground, now are doing the same work for more money, so the extra goes straight to their bottom lines. That is where the pop comes from for GDX over the GLD ETF.
The other thing I like about the gold miner ETF right now is that it is stretched to the downside AND coming off prior support. Set a logical stop below that area, and you have a good trade set-up with a reward: risk that is much better than 2:1 (check my "Buying Checklist" page before buying and to fully understand the reward: risk ratio concept - see button on blue bar to upper left). Of course, GDX and the GLD ETF may bounce and penetrate their lows, so that is what the stop loss is for. Set one that you can live with and stick to it. You can always get back in.
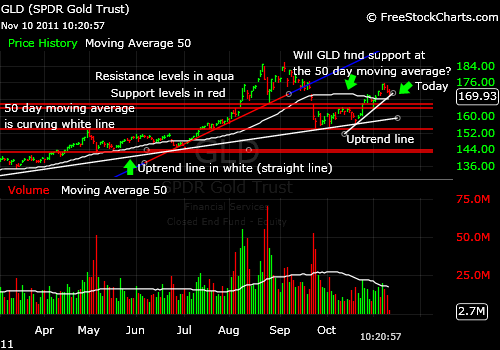
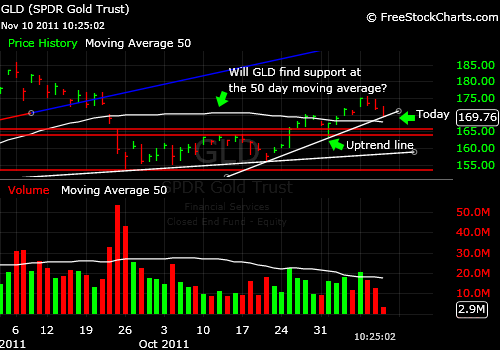
Gold has been slowly recovering from its recent correction. Most recently it failed at the 50 day moving average, then bounced back. I like the gold etf chart better than the SLV silver ETF chart as I mentioned on Twitter on Friday. The risk to silver is a possible worldwide slowdown as well as the liquidity crisis. The risk to gold is a further seizing up of liquidity with forced liquidations of gold and GLD shares by hedge funds and central banks.
Fear is abating a bit, but the markets are still edgy. That is why gold is not exploding upward yet. Gold is better off when the world is slowly printing more and more paper money. Look back to 2008 and you'll see the kind of correction gold can be subject to when numerous other markets get cheaper.
Gold has started a correction and is rapidly approaching the uptrend line on the daily chart as shown in both of today's GLD ETF market timing charts below. The next stop below there would be the 50 day moving average, so gold does not have to totally fall apart here and there are good fundamental reasons, namely the Euro Mess that would make one believe that gold will maintain a reasonable bid for a while to come. The software used to create the charts is provided by Worden Brothers (see my "Other Resources" page for more on their charting software).
CONCLUSION: Gold is correcting and buying it BEFORE it bounces is not a great strategy in my opinion unless you use a tight stop at each possible support point and get out if you are wrong. If you own no gold, you could buy the support points but save ammo for lower prices for gold. Eventually gold prices will likely go higher for one reason: demand for the one remaining reliable "currency" on the planet. Even the Swiss Franc is being manipulated down and is not back entirely by gold any longer.
And where is the Stock Market headed?
11-03-2011The critical number to watch on the GLD ETF is in the comment section below.
11-02-2011: Latest Comment on Gold
11-01-2011 - There is a new extensive comment below on the recent move down by gold from the 50 day moving average (see below).
Check out the most recent comments in the Comments Section below. Be sure the Comments are set to "Reverse Chronological Order" using the down arrow at the top. If the new comment does not appear with today's date, please see the comments on my Facebook page here: Recent Market Timing Comments
9-16-2011: Is Gold Going Up or Down???
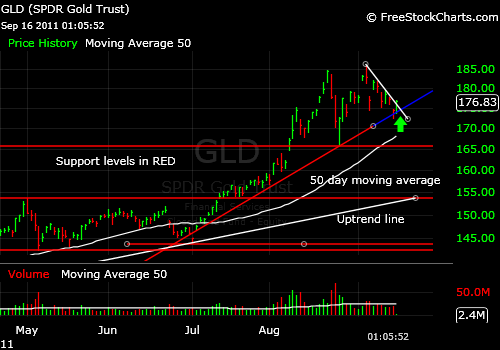
Before I answer, study this chart in detail. Feel free to add your own conclusions to the comments below.
Charting system provided by Worden Brothers; see my "Other Resources page for more information): 1. Gold has corrected from a double top. It is in a correction.
2. There is some support from which gold has bounced over the past two days. If you look at the market timing chart above, the GLD ETF is bouncing off of the red uptrend line with the blue tail at the upper right. Breaking that support would bring the GLD ETF down to the 50 day moving average for it's next stop and then to the red support lines.
3. The GLD ETF is now just above the white downtrend line to the upper right. That is positive. On Twitter today I said: "Close over 178.60 would be bullish." This is still more of a sell point than a buy until we see that close. Even a move up through that point intraday may be enough.
4. The other thing favoring gold is that Europe is still a bit dicey. My view is that it is dicey but improving due to the impending interventions, but the doubts keep a bit of a bid in the GLD ETF. If Europe does NOT act in an adult manner and stabilize its finances, all bets are off and gold will rally back to the last high at a minimum.
CONCLUSION: Gold is right at a critical pivot point. Such a point means it is at support and has the opportunity to rally, but if it does NOT fairly promptly (a couple days at most) rally, it will correct back down to the 50 day moving average at a minimum.
9-04-2011: Is Gold Buyable on a Technical Basis???
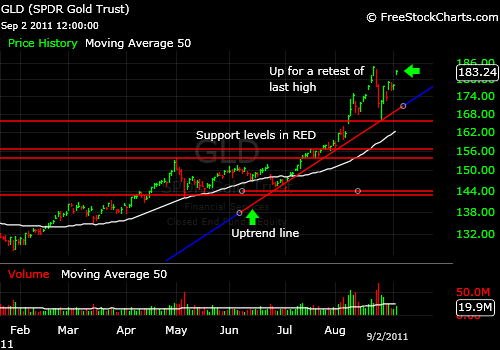
Charting system provided by Worden Brothers; please see my Other Resources page for more information.: Is the GLD ETF buyable here? The short answer is no, unless you are very unexposed to gold at this point. Then I suppose one could argue that an investor should buy at every point, and plan on buying more lower AND higher. On a technical basis, the GLD ETF must make it over the last high and continue moving up to trigger the next buy signal.
That number is at 184.82. That was the last high that we need to exceed for the next BUY signal. Why buy the GLD ETF when it is just below there, in a state of "stretch" on the chart, meaning it is far above any reasonable uptrend line you could draw? If you draw a line connecting the 1-27-2011 and the 7-1-2011 lows, it hits the price scale on the right at about 150 or so and we are currently at 183.24! That is stretched.
When chart trends become parabolic, where the rate of increase keeps increasing more and more, they become susceptible to correction. That is where the GLD ETF is at today - in need of a correction. Panic into gold based on the Eurozone financial fears is driving up the price of gold to what are "unnatural levels." By unnatural, I mean levels where the price will correct violently when the panic dissipates, which it often does.
What's the catch? What could just propel gold to $2500 without stopping? Total economic disaster in Europe and the dissolution of the European Union and the Euro would do it. Could it happen? Some argue cogently that it could. Others don't buy it. You'll have to decide for yourself, and feel free to leave your comments below.
CONCLUSION Gold is not at a good technical buying point, but it certainly is NOT a sell. Gold will continue to be an intermediate term hold at least for at least a few years, as long as you can afford to lose up to 20-30% in dollar terms if you buy near here. Corrections of that magnitude are not that uncommon. Look back at 2008 and note the sizeable correction in gold and the crash in silver. So if you cannot afford to hold gold through corrections like that, trade it instead. My newsletter will likely help you with that goal. And please read the article linked below the comments block. It shows exactly how overpriced gold has become, at least for now. Yes, it can become more overpriced just as Yahoo's stock did in the late 1990s when it went to around $108 per share (now at $12.87).
So do NOT invest in the GLD ETF money that you will need to access within the next couple of years. Add to your core gold position as you accrue more and more wealth, some say at least up to 5% of your assets. Some say more, at least under current circumstances.
And perhaps you'll decide to use a stop loss on part of your long term position to avoid giving back too much of your gains if you've had them. That is a matter of choice and of your financial flexibility. Does Jim Cramer who is supposedly worth over $100 million need to sell any of his 20% gold position? Probably not, but even he will likely lighten up a bit once the dust settles from the current financial crisis and he'll be invested more in tech stocks etc. at that point.
8-23-2011: Is Gold Cheap???
Gold Analysis: Is Gold Cheap???
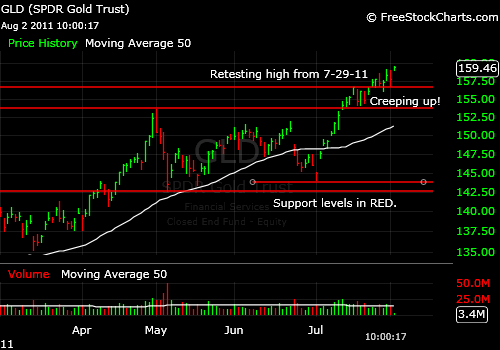
8-02-2011 Here is what the GLD ETF Chart looks like now (charting system provided by Worden Brothers; please see my Other Resources page for more information.)): Gold is creeping up making small breakouts, bit by bit, so the chart is OK. The gold ETF is still an up trend. The rate though is slower, which tells you gold investors are more tentative than before, so now is the time to use a stop. The red lines on the chart show you some of the key support levels. One not shown is the 7-28-2011 intraday low represented by the green line. The widest stop I would consider is to allow for a retest of the breakout at 153.61 above the May 2nd high, but that is a bit too low for my taste.
The US dollar index is gaining some tone after the debt deal, so the US dollar is bound to pressure the price of gold in dollar terms. If the US dollar becomes too strong, too fast, gold will correct, and it will fall below several of those red lines. For now, its a Bull market.
Always adapt my comments to your own investing style, and you will do well.
Prior post on GLD ETF: Prior Post on GLD
7-26-2011: Gold and the GLD ETF have made it over prior resistance and the gold breakout is intact. We may still get the retest of the breakout if the debt ceiling issue is resolved however. It could fail if it does retest the breakout, especially if Europe is calm.
07-20-2011:Gold On Pause
Gold hit $1600 per ounce (GLD ETF hit 156.58) and decided to take a nap. It has pulled back and will likely retest the breakout point of 1575.79. For the GLD ETF that translates into the prior high of 153.61, but 153.45 may be more accurate when you translate between gold prices and GLD and look at what that ratio is. The point is that the GLD could retest around 153.45 and that would be fine. Believe it or not, this is one of the only places to find the all time high for gold. For some reason, London closes etc. are often quoted. THAT is the number to watch.
For the gold rally to continue we can either:
1. Stay above that number while pulling back
OR
2. Pull back a bit under that high and not plummet into a further correction. Then the breakout to new highs will be intact.
OR
3. Make a new high. But on the way to attempting that the GLD ETF could move back up to about 155.67 from here, fail to make a new high and come back down and retest the breakout.
Practical Trading/Investing Advice: There is no reason to rush to buy gold or the GLD ETF now that it is easing back. If you don't own any, that may be a reason to buy it slowly of course, and I have never advocated trading out of long term positions for years.
But for a trading position, the above parameters are the ones to watch. If you see gold retest slightly below the breakout and recover, that would be a perfect buying point. Then you simply have a tight stop in place. Remember that it is your money so do what you feel is right for you. If you are not a "trader," don't trade, but do have some point in your mind where you will get out if any investment turns sour. Right now, the gold breakout is fine.
What if gold goes straight up? Right here, we are at some support (154.79 is support on the 15 minute chart for example). You could buy here with a fairly tight stop. Then watch how it behaves as it moves higher and maintain some profit as best you can. And if gold goes straight down, you'll be needing a mental stop to protect your capital.
07-15-2011:Gold Breaks Out! Latest Gold (GLD ETF) Comments
07-01-2011: The May GLD lows will provide initial support and then look for around 141ish if those levels do not hold. Gold has slipped because the European situation in regard to Greece has subsided enough to restore investor confidence. The US dollar has slipped along with gold. As I pointed out, the opposite pattern is typical of what I call the "European Panic Scenario," which is gold UP, US dollar UP, and stocks DOWN. We are simply reversing that right now. For the resistance points, see the 7-5-2011 Brief here: Market Timing Brief
06-10-2011: A GLD ETF Timing Article about where the gold is headed: We'll Just Have to Wait
Gold has formed a high and has pulled back from that high. The initial correction was 7.2% based on intraday highs and lows for the GLD. Then a higher low was formed, which provided support for the latest rally.
That GLD ETF rally has now stalled a bit. The gold market has been in consolidation (sideways motion) for about 10 days. GLD is either going to limp down to a retest of support at around 146.5 for the GLD or retest the last high at 153.61.
The way to play a consolidation as a trader is to act according to the direction of the next break.
What is negative for gold at the moment is that:
1. The Federal Reserve is turning off the printing presses with the end of QE2 at the end of June. The monetary situation could become deflationary.
2. China and the rest of the world are RAISING, not lowering rates, so growth is going to slow worldwide. It already has. This is deflationary and works against gold.
3. The housing situation is still bad, so the root cause of the financial crisis in still on the table and is a big drag to our economy. Hence, deflation rather than inflation becomes the risk.
The Federal Reserve, as I Tweeted this am is in "Fed jail." They can either have Fed induced inflation with resulting slow growth or they can do nothing and have deflation with slow growth. They hoped to be able to stimulate the economy and avoid inflation, but it did not work. They clearly had the public up in arms about gas and food prices. There were riots in several locations around the world concerning food prices. The policy FAILED.
Jim Rodgers said yesterday on Larry Kudlow's CNBC show that it is inevitable that the government printing presses be turned back on. I would agree, but in the interim, temporary deflation could be seen until the next lamebrain government intervention is designed and rolled out.
I say lamebrain, because economies are really like patients. If you think a patient needs an antibiotic for an infection, you prescribe a reasonable dose. If the patient does not get well in a day, do you then increase the dose ten-fold? No. You JUST HAVE TO WAIT. The government responds politically and is terrified to admit that "nothing more can be done" for the patient, in this case, the economy. Some healing just takes time and throwing more medicine at it can cause side effects, like inflation.
CONCLUSION: The GLD ETF is likely to pull back as temporary deflation occurs due to Fed inaction and the US dollar rallies. The GDX is already signalling more weakness in the metal. But it won't likely last for long and is being somewhat mitigated by Central Bank buying of gold and the sense that investors are getting that "GOLD IS REAL MONEY." Do you sell your dollars and buy Euros every time the dollar goes down? So do you sell your gold? Your trading position, YES. Your core position, NO, in my opinion.
Always remember that it's your money and your decision as to how to invest it. 05-08-2011:
Gold Is Breaking Down Please get the latest update on how the US dollar is bringing down gold here: The Buck Stopped THERE and is Going Up For Now
GLD has broken out again. The latest new high was achieved on 4-15-2011 and trend has been up since then. Even yesterday's blip down did not start a down trend. Not yet.
The key as mentioned today in my mid-week update (see "Read My Feed" and click on the mid-week update link), is the US dollar. Gold has a hard time making progress when the US dollar is strong. The only time they move together is when there is general market/world panic and during the Libyan crisis, that correlation FAILED to work for the first time in a long, long time, raising concern that the US dollar has already begun to lose it's standing as the world's top reserve currency.
All that aside, the Fed has the power to turn off QE2 early or stop buying paper whenever it wants. The Fed has been printing money to buy massive amounts of our own government's debt and slapping that on its balance sheet. It is a big charade that must end at some point. It is only because the economy is extremely weak that they have been able to get away with this deception for this long.
Here is an actionable number: If the Fed drives the US dollar back up today with its comments and the dollar index makes it back up through 74.23, the gold rally and all the other rallies referred to in my mid-week update will FAIL and correct a bit. A close of the US dollar index above 75.63 would turn a downturn into a much stronger correction of 10-15%. And the GLD ETF would correct strongly as well.
Currently all updates of my take on the GLD ETF are noted on Twitter (follow link to right) and are included in the Wall Street Sun and Storm Report™. Subscribe at no cost here:Wall Street Sun and Storm Report™
By the way, I'll be in touch with material ONLY available to FREE subscribers to the newsletter. You will get the password to the Market Comments Page right away.
I always save significant detailed information on resistance and support levels for that report that you can access ONLY with the FREE password. Scroll up to sign up.
As always, it's your money and your decision as to how to invest it.
Much more on gold in this month's free issue (out by Sunday night; subscribe at top right).
As always, it's your money and your decision as to how to invest it.
As always, it's your money and your decision as to how to invest it.
As always, it's your money and your decision as to how to invest it.
5-31-2013 Close: Gold In A Weak Bounce
As always, it's your money and your decision as to how to invest it.
As always, it's your money and your decision as to how to invest it.
As always, it's your money and your decision as to how to invest it.
As always, it's your money and your decision as to how to invest it.
As always, it's your money and your decision as to how to invest it.
4-05-2013 Close: GLD ETF Broke Support and Recovered
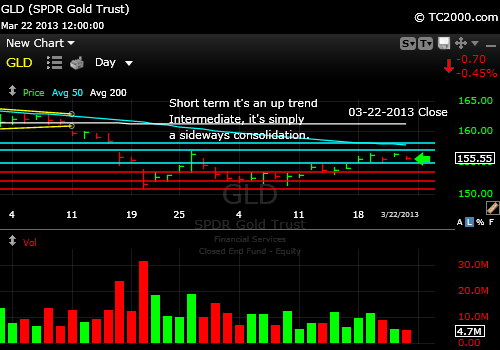
3-22-2013 Close: Gold ETF Finally Has a Shot!
3-15-2013 Close: Gold ETF Has Formed a Strong Base
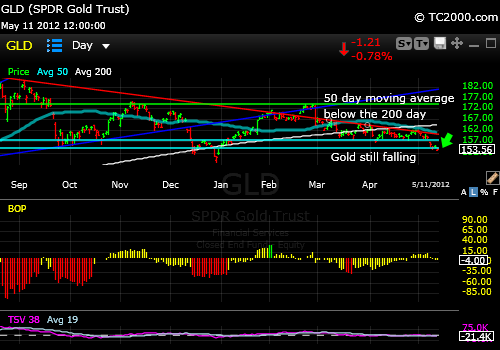
GLD ETF Market Timing Chart for 5-11-2012 Close Gold has yet to stop falling. The December low could be next.
12-29-2011: Gold ETF (GLD) Has Broken Major Support:
12-16-2011: Gold Miners (GDX ETF) vs. the Gold (GLD ETF)
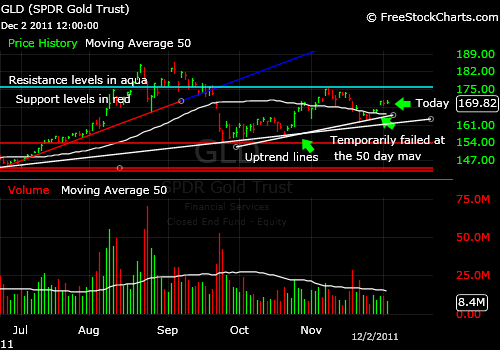
12-03-2011: Will the Recovery in Gold (GLD ETF) Continue?
11-10-2011:Gold Is In a Correction
You'll be surprised by this analysis of the price of gold:
4-27-2011: A Gold ETF Timing Article about where the GLD ETF is headed.
All charts were produced via TC2000.com which is a registered trademark of Worden Brothers, Inc., Five Oaks Office Park, 4905 Pine Cone Drive, Durham, NC 27707. Ph. (800) 776-4940 or (919) 408-0542. www.Worden.com. Please click on the link on my "Other Resources" page for more information.


