|
Market Timing the REIT Index ETFs NOTE:Currently all updates on the REITs are noted on Twitter (follow link to lower right) and are included in the Wall Street Sun and Storm Report™ and in comments on the private access page ("WSSSR Access" on the blue bar to left). Subscribe at no cost here: Weekly Wall Street Sun and Storm Report™ Please refresh your page to see the latest REIT chart below. Thank you. REIT Comment for 6-16-2013 based on the 6-14 close: The REITs corrected dramatically from the stretch shown on the prior chart (scroll down to the chart): REIT Chart when REITs were Stretched . The US REITs have staged a small reversal, the possibility of which will only be manifest if the general US market rallies from here. The key will be whether interest rates break their recent up trend. If you see another new high in the 10 Year Treasury yield, rates on the 10 Year Treasury will likely hit 2.4%ish. If you see a breach to the downside of the 2.086% level on the 10 Year, you could see a further rally in the REITs. As my belief is that rates will edge up over time, buying REITs will be a pure trade for a while in my opinion. REIT Chart for the 3-04-2013 Close can be seen at the link just below. REITs need to break out soon or will suffer another corrective move: REIT Chart for Open on 7-09-2012
If you found this helpful, could you please "Like" it below? Thanks very much. REIT Chart for Close on 3-23-12
REIT Chart for Close on 3-16-12
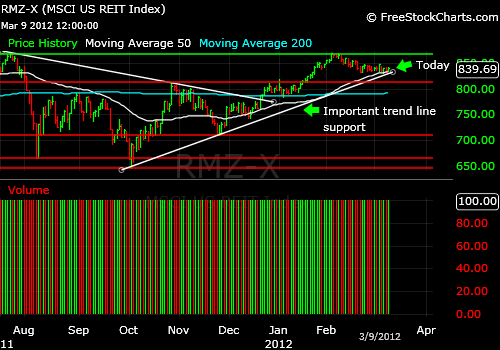
REIT Chart for Close on 3-09-12
12-03-2011: REITs are Back to a Buy. I was buying the REITs as they broke up above the early December high and now they have moved above the down trend line of the triangle formed by the daily downtrend and uptrend lines. The volume for the REIT ETF, VNQ, was not great, so we want to see follow through and more buyers come into the market. See the chart made via the Worden Brothers software (Link on my "Other Resources" page on blue bar to left.
12-03-2011: The REITs came off of a higher low in November and is headed up as shown in the chart drawn after the close on 12-02-2011 (plotted using FreeStockCharts.com. See my "Other Resources" page for more.) The REITs face resistance at the August and October highs as shown on the chart below. It appears to have room to rally at least that far. If the liquidity crisis deepens, REITs are very exposed via their need for financing, so there is significant risk. As always, it's your money and your decision as to how to invest it.
11-08-2011: REITs (MSCI US REITs - RMZ) is Showing Weakness Specifically, if you look at a chart of the RMZ REITs, you'll see that the REITs made it over the 50 day moving average and then pulled back. We are now just below the intraday high on 9-10-2011. There has been a gradual recovery from the pullback, but the REITs have not been able to get back over the resistance level that was formed from 11-02-2011 onward. Given their usual volatility, the fact that they are not breaking down hard now is actually a positive sign. CONCLUSION: In market timing terms, the point is that there is no point in buying the REITs below 798.24 where the intraday high was on 11-02-2011. If you bought near the recent lows, you may not want to ride your holdings all the way down, but logical support would be first the 11-01-2011 low and then the 50 day moving average. Setting a tighter stop may work better, although you run the risk of giving some gains up if the market gaps up. As always, it's your money and your decision as to how to invest it.
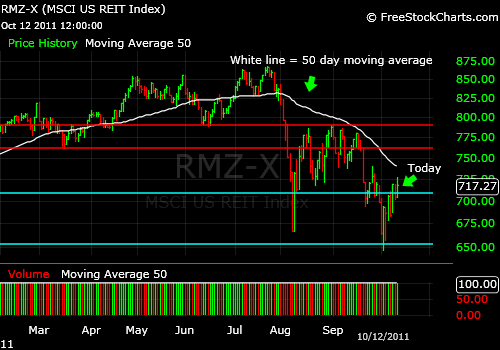
10-12-2011: REIT Index Is Weaker than the Overall Market The REITs failed to break out above the high from two days ago. That is weakness in market timing terms. Note where the index failed during its last rally vs. the 50 day moving average. This pullback toward the end of the day today is at about the same distance from that moving average. So REITs COULD simply fall from here. This is the REIT index (RMZ)at the Wednesday 10-12-2011 close (charting system provided by Worden Brothers at FreeStockCharts.com): REITs have been very volatile as there is concern in the market about financing for REITs in the so-called "repo market." This has made the moves in REITs as dramatic as in the banks. Very dramatic 4%, 5%, even nearly 10% moves back in August. So tread lightly at this point. Until volatility goes down somewhat the REITs are one of the more dangerous places to put your money.
10-04-2011: REIT Index Could Test the Summer 2010 Lows Next Look at the chart below. The REIT index has closed below the August low and until it moves back above that low, the next target will be the summer 2010 lows. Holding up just below the break from yesterday is not going to do it! A sideways pattern (consolidation) below a support level does not ensure a recovery. It means a further break is still in the cards. If you liked this post, please "Like it" and/or retweet it below. Thanks. 8-05-2011: REIT Index Has a Long Way to Fall Still The REIT Index has had quite a run from the March 2009 low. There is quite a bit of room for the index to fall, even though it has corrected substantially over the pat few days. This is the RMZ index at the Friday 8-5-2011 close (charting system provided by Worden Brothers at FreeStockCharts.com): The Aqua lines represent possible levels of support on the way down. It is not impossible for the Real Estate Investment Trust Index to fall to the lows of last summer. We will have to see if a bottoming formation starts to develop at some point. It is likely that this will be required for another strong rally to start. The REITs may be vulnerable to the downgrade of US debt on Friday. The initial reaction on Monday will be telling.
7-11-2011: REIT Index Joins the Sell-off in Stocks REITs have just failed a breakout above BOTH the April and June highs. They are now a sell. There is no point buying them until either: 1. They have fallen enough to be of better valuation. 2. They have fallen enough and have formed a base from which they are then bouncing. 3. They make a new recent high above those the highs mentioned. Otherwise you are fighting the tide, which at the moment is down. (see my Market Timing Brief via the link on my "Read My Feed Page" here: Market Timing Feed Page )
06-20-2011: REIT Index Bounces The REITs are bouncing today, actually leading the other markets. That said, there is nearby resistance at both the 3-1-2011 high of 819.42 for the RMZ Morgan Stanley REIT Index and at the 50 day moving average, now at 822.86. If you buy a move through those resistance points, remember that markets can sometimes briefly test above resistance and then fail, so set a stop in case you are wrong. As you know, it's best to use a mental stop rather than leave a stop loss order in the market as burned investors found out on May 6, 2010 in the Flash Crash. 06-10-2011: REIT Index Breaks Support The REITs broke support on the close yesterday and triggered a SELL signal. We are now below the February high for the Morgan Stanley Real Estate Investment Trust Index (RMZ) and below the prior lows for both May and June. The next support level down is the April low and then the March low.
04-01-2011: Market timing the REIT Index ETFs
The US Morgan Stanley REIT Index is now hitting a resistance point at the 2-16-2011 high of 805.92. The next resistance above there is 819.42. If you plan to buy a close above 805.92, but the actual close is close to 819.42, there would be little point in buying until a new high is achieved. In the paid newsletter, we bought the close above 791.80 in the index on 3-30-2011. We'll continue to add as further progress is made. The REITs still lag the overall market in recovery. For example, mid-cap stocks represented by MDY are making new highs - brand new highs. The REITs are far behind. So if the economy is actually recovering slowly as we are told, the REITs should catch up to the rest of the market. There has been a lot of talk about inflation by prominent forecasters like Bill Gross. This inflation, if it does kick in across the economy and not just in food and energy, will lead to higher rents over time and help REITs with a catch, because the flip side of that is that higher interest rates for REITs requiring refinancing of loans spells trouble to their bottom line. It also means that REIT yields can start to look puny compared to bonds as yields rise. So the best thing for REITs would be continued low interest rates and the REIT stock sector will be vulnerable to correction if there is significant inflation accompanied by higher interest rates. 03-22-2011: An ETF Timing Note about market timing the REIT Index ETFs
The REIT index has failed to make it over the prior breakout point of 789.86 and also failed to maintain a close over the second resistance point of 784.05, the 50 day moving average. This would be a perfect place for it to fail and fall back into a further correction to at least 761 or even to around 748. Business is improving, but still slowly due to our high unemployment level and the tightness of credit for risky new businesses. 1-05-2011 Update The REITs swooned again yesterday. So let's see if my prediction last time held up. Take a look at what happened in November when there was a high volatility downside day just as we saw yesterday in the REIT index. You can see that the market DID in fact pull back dramatically.

Currently all updates of my take on the REIT Index are noted on Twitter (follow link to right) and are included in the Weekly Wall Street Sun and Storm Report™. Subscribe at no cost here: Weekly Wall Street Sun and Storm Report™ Chart courtesy of Worden Brothers, Inc. at FreeStockCharts.com. See also my "Other Resources" page on blue bar to upper left. HERE IS THE KEY TO THE CHART: RED LINE: Prior breakout point that FAILED in November. BLUE LINES: Support levels to which the market could descend on a deeper pullback. WHITE LINE: Up trend support line to which the market could fall and from which it could bounce. CONCLUSION: The REITs should now fall to at least the mid-December if not the mid-November levels to start with. We have to see how the overall stock market holds up to know how deep this pullback will be. There is a larger looming significance to this pullback. In past REIT pullbacks, the general market has come along too in the end. It may be a sign of the first market crack for the S&P 500 Index and other stock markets as well. What would void this signal? Only a new high would erase the effects of this SELL signal in the REITs and as I just said, a pullback that is more likely now for the general markets. What do you do? You must make your own decisions as it is your money, but I would set some stops and rebalance your portfolio at a minimum. If you take money OUT of the market you MUST be willing to put it back should the signal reverse. You may simply set stops below current levels where you will sell "no matter what." You can read more on this investment approach on the page devoted to "Passive Shorting.™" And be sure to sign up for my FREE weekly SP500Tracker™ here:
SP500Tracker™
The US REITs have just pulled back from a breakout on the daily chart (shown below). The Red line signifies the breakout point and the price today is in the circle which is now BELOW the breakout. That is called a failed breakout. Now it does have to close below the red line to say it may have failed and then keep moving lower. It will take another day or two to prove there is a new trend, even if it only lasts for a couple of days. The possible support levels are shown by the blue lines. The price could fall to the first support and then bounce, particularly if the rest of the US stock market remains strong. 
Chart courtesy of Worden Brothers, Inc. at FreeStockCharts.com.
Chart courtesy of Worden Brothers, Inc. at FreeStockCharts.com. CONCLUSION: The REITs may generate a SELL signal at least for a short term correction if the close is below the breakout point at 771.05 (RED LINE above). 1st support is 752 then 741.04. So what could you do to profit or PROTECT your profits? If you have large profits in a REIT ETF or in one REIT, make sure you check it to see if it matches this technical picture. If it does, you may want to either take profits or sell should it drop by X%. You will have to decide how much you will give up. Just don't give back all your profits is my opinion! Read my page on how to go "passively short" if you want to learn more. What else could you do? If you would like to know ALL my thoughts in regard to ETF timing /market timing "Tips" like these, simply sign up for the FREE "Tips" newsletter below. I'll be in touch with material ONLY available to FREE subscribers to the TIPS and SP500Tracker™ newsletter. You will get the password to the Market Comments Page right away. Please enter your email address and first name and HIT SUBMIT in the box to the upper right. I'll be "speaking with you" again when I have another insight to share.
Simply enter your email address ABOVE (which will be kept private) above and you will get the password to the Market Comments Page right away. PLEASE NOTE THAT THE "ENTRANCE" to this webpage is on the blue Navigation Bar to the left on the home page labeled "Tips Access Here." PLEASE MAKE A NOTE OF THAT FOR FREE PRIVATE COMMENT ACCESS. For now, please enter your email address and first name above and HIT SUBMIT. I will notify my whole FREE list by email when the next "Tip" is ready. All charts were produced by FreeStockCharts.com which is a registered trademark of Worden Brothers, Inc., Five Oaks Office Park, 4905 Pine Cone Drive, Durham, NC 27707. Ph. (800) 776-4940 or (919) 408-0542. www.Worden.com.
|