SP500Tracker™
...Market Timing the SP500 Index
The Latest SP500 Index Chart posted to my Market Timing Blog is HERE:
Latest SP500 Index Chart Update
However, further updates of my take on the SP500 Index are
noted on "X," (formerly Twitter) as @SunAndStormInv
and as
@SunAndStorm™ on StockTwits
where you will get my posts faster...
The newest chart is on the Market Timing Blog. Click the 2nd button down on the blue bar to the upper left and scroll to what will generally be the first chart...
The following are post archives:
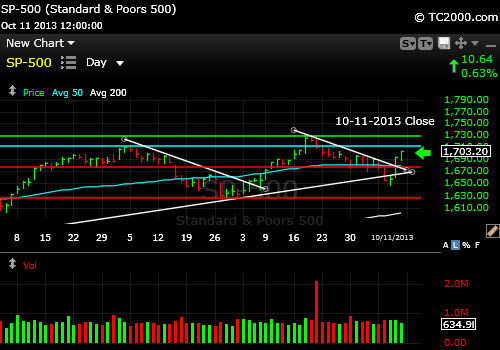
10-11-2013 S&P500 Index Close: Latest Update. Read the text by subscribing at the link to the upper right. This week there will be a brief update by Sun. p.m. on the "WSSSR Acess" page.
Please like this page below and as usual, it's your money and your decision as to how to invest it.
Please see my "Other Resources" page on the blue bar to read about my charting software by Worden Brothers. It takes me seconds to do on their charting system that takes me minutes with free commonly available systems. It is well worth the investment.
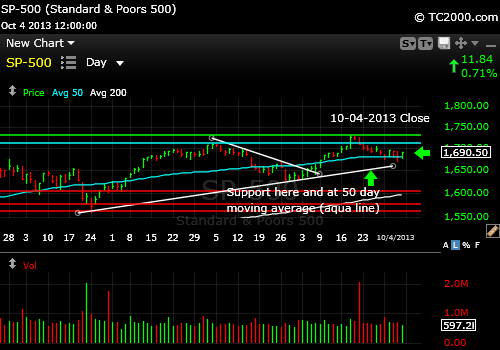
10-04-2013 S&P500 Index Close: Latest Update. Read the text by subscribing at the link to the upper right.
Please like this page above and as usual, it's your money and your decision as to how to invest it.
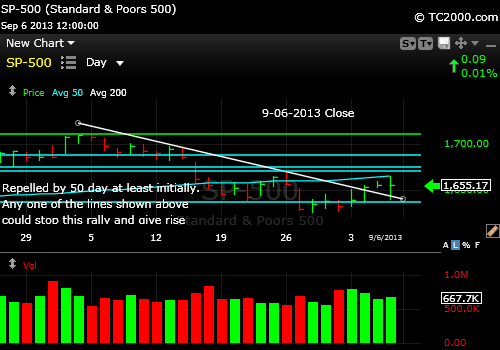
9-30-2013: Latest Update: Market Timing the SPX: SP500 Falling to Where?
9-09-2013: Where is the Overhead Resistance? The chart below shows that there are challenges for this market, which may now simply rematch a lower high and turn back down. The Bulls claim the economy is improving and investors are afraid of bonds and that will provide the buying power to take us to new highs. Take a look at the chart and be aware of where the better buying points are if you are buying. Buying exactly AT the 50 day moving average would not be a great idea for example.
The 50 day moving average is the upward curved aqua line in the chart below.
Could you please like this page using the Facebook "Like" button just above? Thanks.
As usual, it's your money and your decision as to how to invest it.
9-04-2013 Tech vs. SP500: The chart shows that Big Tech represented by the QQQ (NDX) has been holding up much better than the SP500 shown as a yellow line in the chart(SPX, SPY). Investors are favoring growth oriented companies over slower growers. See my other recent posts on the access page for free subscribers. And see the SP500 charts below this one.
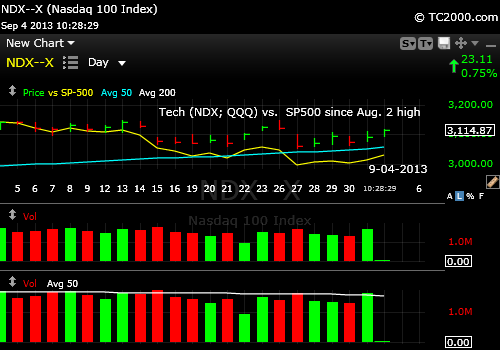
As usual, it's your money and your decision as to how to invest it.
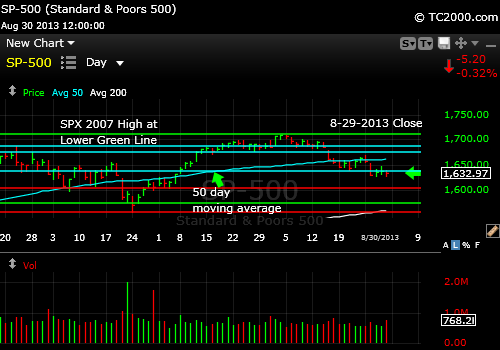
8-31-2013 S&P500 Chart Update The S&P500 Index is both below the 50 day moving average and closed below support based on Syrian War worries that will likely continue into next week as the "action" has been delayed as we wait for the judgment of Congress. Much more on the SP500 and 34 other indices in this month's report out this Monday evening. Subscribe to the upper right.
S&P500 Chart Update for 8-29-2013 Close
And the chart below shows where the next support lies below...
Could you please like this page using the Facebook "Like" button just above? Thanks.
As usual, it's your money and your decision as to how to invest it.
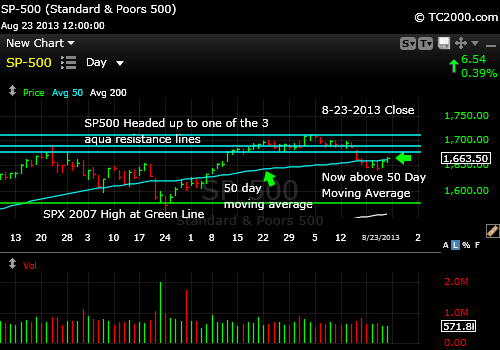
8-25-2013 SP500 Chart Update The SP500 is bouncing and I explain in further commentary on the page labeled "WSSSR Access" on the blue bar to the left, where the bounce will likely end. Become a free subscriber to read it using the link to the upper right.
SP500 Chart Update for 8-23-2013 Close
Could you please like this page using the Facebook "Like" button just below? Thanks.
As usual, it's your money and your decision as to how to invest it.
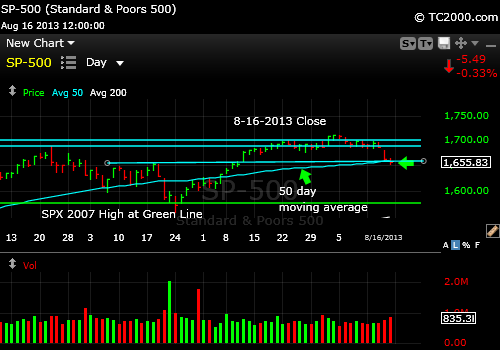
8-18-2013 SP500 Chart Update for 8-16-2013 Close
Could you please like this page using the Facebook "Like" button just above? Thanks.
As usual, it's your money and your decision as to how to invest it.
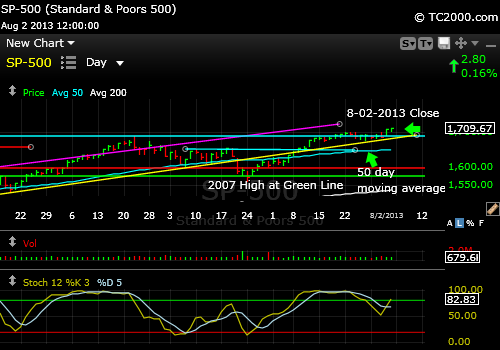
8-02-2013 SP500 Chart Update
S&P500 Index Chart Update for 8-02-2013 Close
Could you please like this page using the Facebook "Like" button just above? Thanks.
As usual, it's your money and your decision as to how to invest it.
The market has at least another step down in this move. Details in this week's report. Subscribe for free via the link to the upper right.
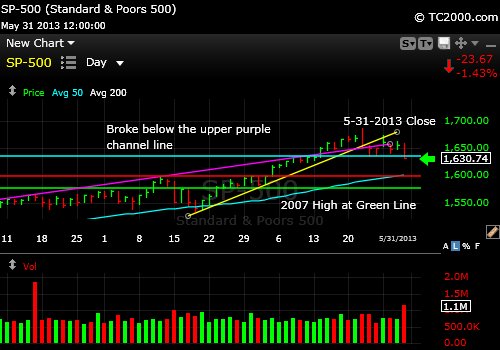
5-31-2013 S&P500 Index Close
Could you please like this page using the Facebook "Like" button just below? Thanks.
As usual, it's your money and your decision as to how to invest it.
05-28-2013: Broken Up Trend
The up trend has been broken along with the upper channel line noted on the chart below and now the stretch is being relieved in a mid-May "go away" scenario. Several weeks ago I pointed out that the "go away" phenomenon has sometimes been a bit "late," though it is still May. Much more in this week's newsletter. Subscribe for free via the link to the upper right.
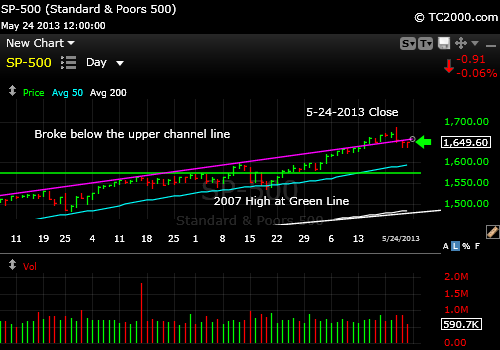
5-24-2013 S&P500 Index Close
Could you please like this page using the Facebook "Like" button above? Thanks.
As usual, it's your money and your decision as to how to invest it.
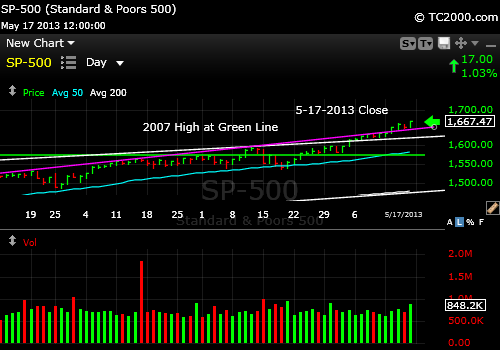
05-19-2013: Higher and Higher
The S&P500 Index is on a roll. Look at the chart below. The aqua line is the 50 day moving average. It touched back to that level on April 18th and then proceeded to rally strongly first taking out the green line which is the 2007 high. Note that it had earlier failed a breakout over that level and came back up to test that level repeatedly falling slightly below it several times, before achieving conviction on 5-3-2013 just to snub the "Go Away in May" Bears!.
Then the SP500 index got above the white upward wedge line just barely and broke out above it, consolidated and then rose to a new level on Tuesday and broke to a brand new high on Friday well above the purple line that represents the top of the upward channel. Up, up, and away as the song goes. The fact that it's now above the upward channel line means the degree of stretch is magnified and that raises the risk of at least a modest correction. At some point, we'll be back at the 50 day moving average or at least back in the upward channel (the lower aspect of the channel is roughly paralleled by the 50 day moving average). This is just the way the market does it. It always eventually reverts to the mean.
Here's the thing. If you wait for that return of the SP500 Index to the 50 day moving average, you may have to wait through a big rally. When the index falls back to a level that is still above where you could have bought it, you are then behind. That is what the market is thinking I believe in pressing it's luck to the upside.
Averaging in slowly and setting tighter stops on the newest positions may be one way to address it. Do what you feel comfortable with, but there is no telling when the next reversion to the mean will occur. I'll comment further on what to look for in the news in this week's free report. Subscribe on the blue bar to the upper right.
5-17-2013 S&P500 Index Close
Could you please like this page using the Facebook "Like" button just above? Thanks.
As usual, it's your money and your decision as to how to invest it.
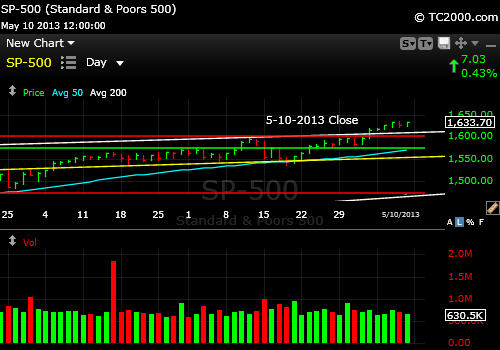
05-10-2013: Breakout Complete, but a Bit Stretched
The SP500 Index has no wedge in the way, but it is a bit stretched vs. the 50 day moving average as the chart shows. More in this week's free issue, and if you want a quick review of how to look at the degree of "stretch factor" in any market, please subscribe for free using the link to the upper left on the blue bar.
5-10-2013 S&P500 Index Close
Could you please like this page using the Facebook "Like" button just above? Thanks.
As usual, it's your money and your decision as to how to invest it.
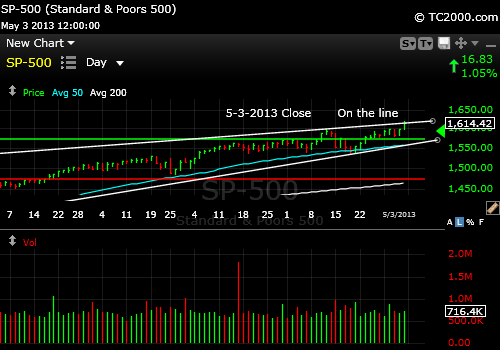
05-04-2013: Another S&P500 Index Breakout with a Wedge in the Way
The SP500 has broken out through the last minor high and has moved up to the top of the wedge shown on the chart. We are still above the 2007 high. Read more in this week's free issue (subscription button at the top of the blue bar to the upper left).
5-03-2013 S&P500 Index Close
Could you please like this page just above using the Facebook "Like" button? Thanks.
As usual, it's your money and your decision as to how to invest it.
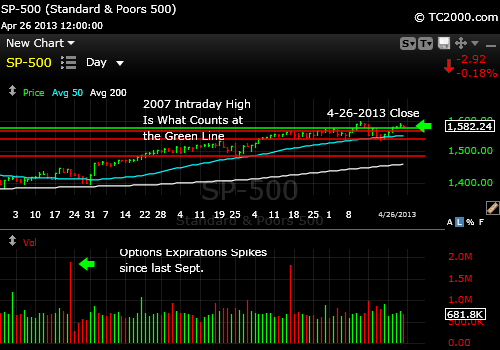
04-28-2013: The SP500 is Holding Above the Breakout Point
So far at least, the S&P500 has regained and is holding above the breakout above the 2007 high. There is nothing to say that it cannot break out again above the recent high, although on the homepage, you can see that the 10 Year Treasury is a warning sign. Perhaps they'll just go away in May as usual the past several years and sell stocks.
4-26-2013 S&P500 Index Close
As usual, it's your money and your decision as to how to invest it.
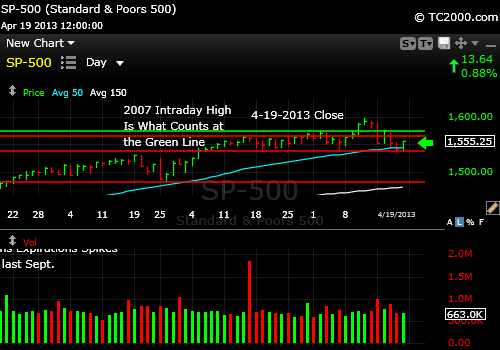
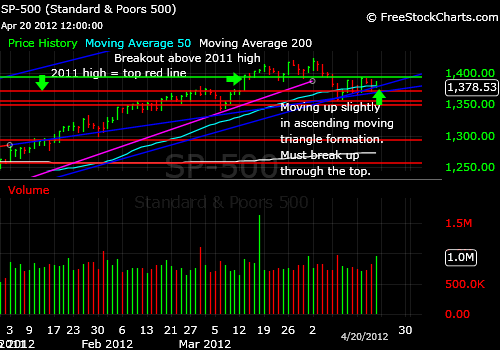
04-20-2013: SP500 Breakout Lost for Now but Held First Support
The SP500 Index closed above the 2007 high last week and back down below it this week. That was a failed breakout. What happened after that is that support was tested at around 1540, which is near both prior multi-week support and the 50 day moving average. It was above both at the close on Friday. The next support is 1485 if the 1540 area breaks down during this next trading week. The Bull argument? The Bulls have a chance for a further bounce, given the fact that support held this past week near 1540. Read more via this week's free issue using the link just below my picture at the upper right.
4-19-2013 S&P500 Index Close
As usual, it's your money and your decision as to how to invest it.
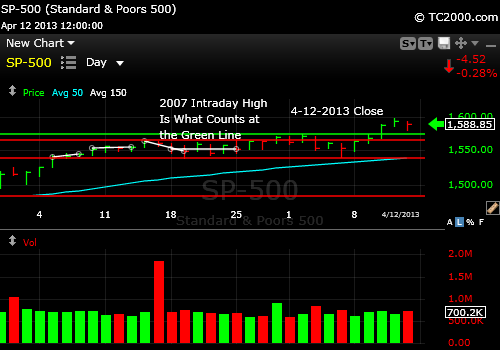
04-12-2013: SP500 Breakout Above Nominal 2007 High
In non-inflation corrected terms, we have a breakout above the 2007 intraday high. More in this week's newsletter. Subscribe using the link to the upper right.
4-12-2013 S&P500 Index Close
As usual, it's your money and your decision as to how to invest it.
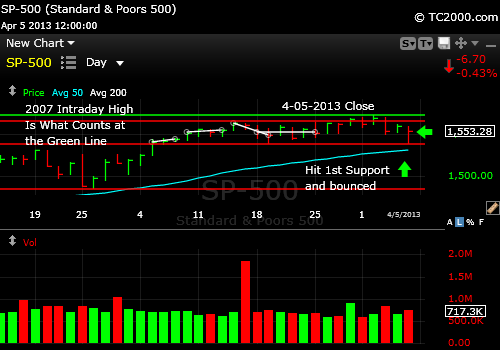
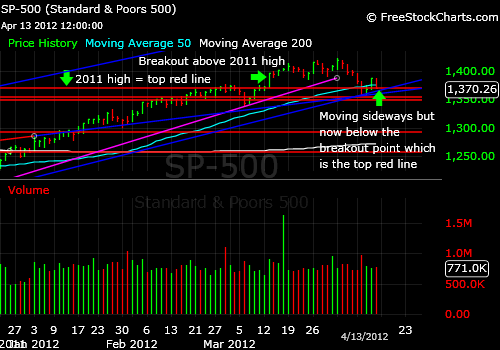
The SP500 Index had broken to a brand new high on March 28th and has now reversed back below the breakout point of 1564.91. It did bounce off the 3-19-2013 low of 1538.57 however, which the Bulls could crow about. The strength shown on the close could extend into Monday with another blip up. That blip must be contained by 1564.91 to prevent a second breakout attempt. There is nearby support at the 50 day moving average, which currently is at 1531.11. The nearest support is at 1538.57, the 3-19 low.
4-05-2013 S&P500 Index Close
As usual, it's your money and your decision as to how to invest it.
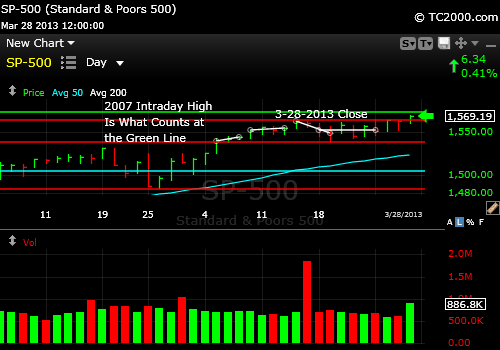
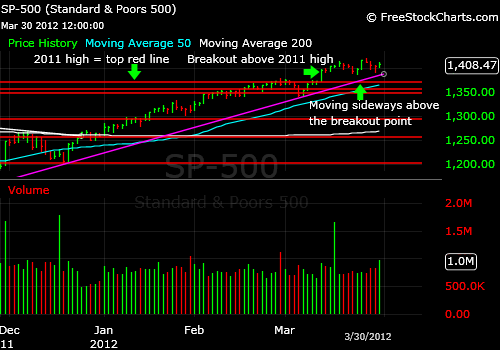
03-28-2013: SP500 Index Is Not Yet Over the Top
The SP500 has made a new closing high, but has yet to climb above the all time intraday high as shown on the chart below. I've added a bit back to my equity exposure as explained in this week's newsletter. Please subscribe to the free newsletter using the link to the upper right (out by 9 pm this Sunday evening ET). I explain how to trade any new position established here or somewhat higher above the intraday 2007 high should we get there! On 3-8-2013, I predicted we would get there as you can see below. Whether we hold that high is another issue. Follow me on Twitter to keep tabs on the pulse of the market this week!
3-28-2013 S&P500 Index Close
As usual, it's your money and your decision as to how to invest it.
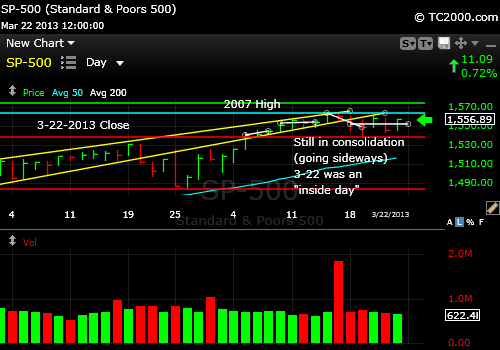
03-24-2013: SP500 Index Has Weakened
The SP500 has lost a bit of momentum. I suspect a further pullback will occur. For more insights on this and other markets, please subscribe to the free newsletter using the link to the upper right (out by 9 pm this Sunday evening ET).
3-22-2013 S&P500 Index Close
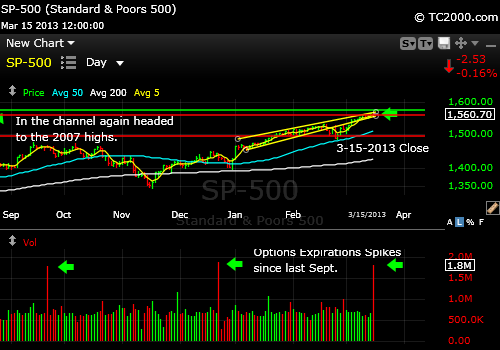
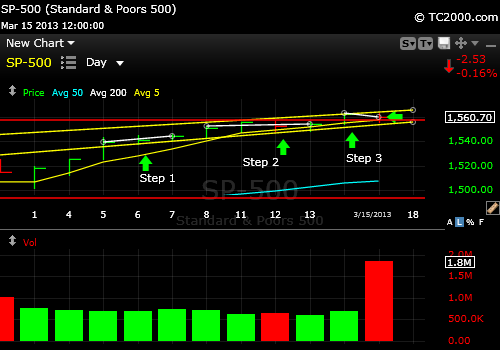
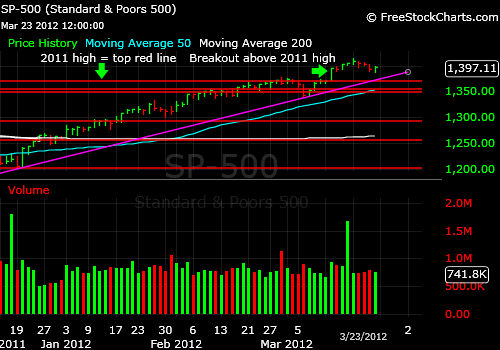
03-17-2013: Slight Further S&P500 Breakout
The SP500 has moved up a bit more since last week remaining in the upward yellow channel shown below for the past 9 market days. Those past 9 days can be broken up into 3 moves. The first move up resulted in a 3 day consolidation (sideways move). The 2nd move up was a 4 day consolidation after the step up and the 3rd, a 2 day consolidation thus far.
This stepwise move up is very healthy. It gives the market time to digest its gains by jerking out nervous investors at each step. Those remaining in the market are then on average more convicted.
I cover two critical additional points in this week's free newsletter, so be sure to sign up to the above right. These include 1. Is sentiment too positive now? and 2. What is the meaning of the big volume spikes pointed to in the chart with the green arrows and what does it say about the near term for the US stock market?
3-15-2013 SP500 Index Close
3-15-2013 S&P500 Index Close Showing the 3 Steps Up
As usual, it's your money and your decision as to how to invest it.
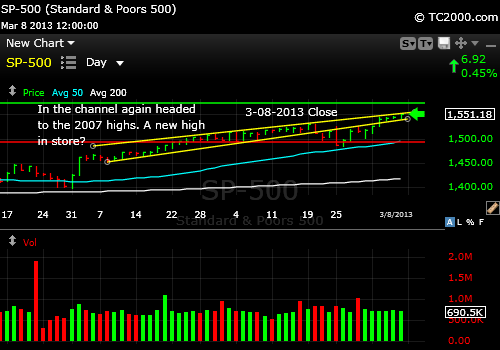
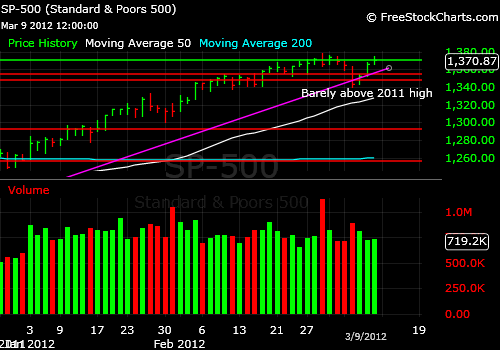
03-08-2013: New S&P500 High
The SP500 made a new high this week, which changes the technical picture and makes the new target the 2007 high. I go through a sentiment analysis in this week's free report that explains why I believe the Bulls have the ball and when they will lose it. In the chart below, note that the index fell out of the upward channel and over the past four market days climbed right back into the Bull mode.
3-08-2013 SP500 Index Close
As usual, it's your money and your decision as to how to invest it.
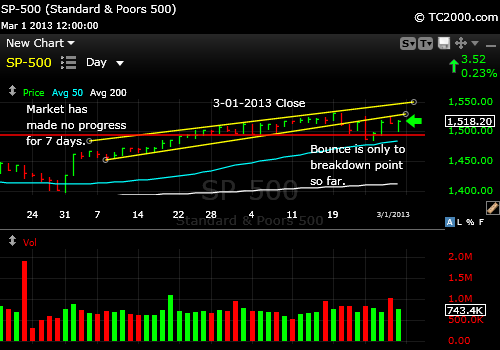
03-01-2013 Still Below the Breakdown Point
Fed Chair Bernanke spoke on Tuesday and Wednesday to Congress and on both days the SP500 was up, but not quite enough. Just as happened the prior Friday and this past Monday, the market rallied only up to the yellow up trend shown on the chart below. That trend line was first broken to the downside in a meaningful way on 2-21-2013. This means that the market has not yet shown signs of a true recovery from that break and until it proves itself by rallying above there, we have no reason to be buying in my opinion. Hold your powder for either meaningful strength as I've just described or a bigger pullback. And I'd use a fairly tight stop if you buy on strength for any new purchases at least.
3-01-2013 SP500 Index Close
As usual, it's your money and your decision as to how to invest it.
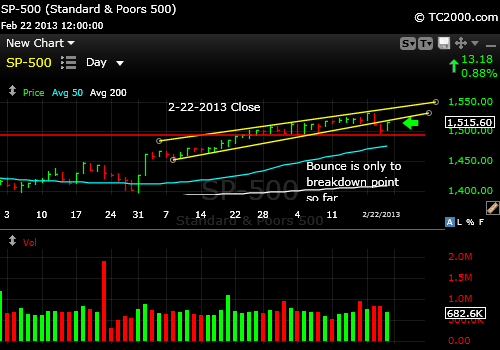
2-22-2013 Close: Break Down and a Kiss of the Trend Line from Below - What Does that Mean?
What happened this past week is that the daily up trend line was broken as shown by the break below the yellow channel in the chart below. Then the market decided to bounce after deciding that the St. Louis Fed governor's comments meant that the Fed would not turn off the monetary faucets in the near future. BUT and here is the important "but"...the bounce only went to a point that is just below the base of that up channel that was broken.
This is a classic example of a perfect short, not a perfect buy. You short after the "channel is kissed." The kiss is a goodbye kiss in case you were wondering. A "Buy Me" kiss would be a rise back up into the channel. Then the trend could continue to at least allow a re-topping of the recent high or my more generous target of the 2007 high. Have a look at the chart below and would you mind taking a moment to "Like" it by clicking the Facebook button just below the chart? Thanks for that.
2-22-2013 SP500 Index Close
As always, it's your money and your decision as to how you invest it.
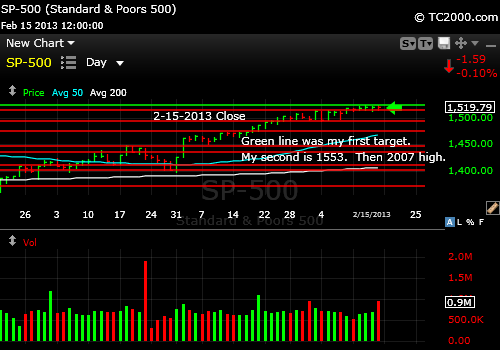
2-15-2013 Close: Last Week was Another Breakout and This Week a Creep Up
SP500 of 1525 was my first target that has been reached. The market has pulled back from there and it would be a possible point for a correction to start, but I believe there more rally left, and the SP500 is still on the way to my next higher target which this week I'm estimating to be 1553, at which point we could see a pause. My next target beyond that would be the 2007 high of 1576.09. Read my weekly report from this week out by this Sunday. I discuss whether investor sentiment is still at a point that it supports a further rally.
2-15-2013 SP500 Index Close
As always, it's your money and your decision as to how you invest it.
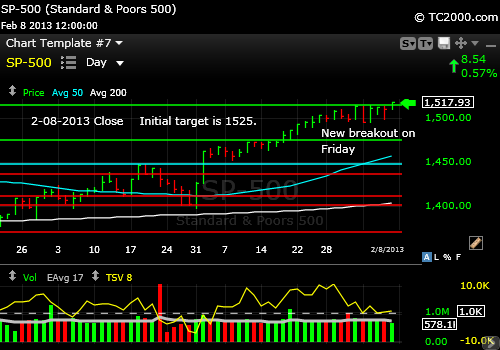
2-08-2013 Close: Another Breakout. When Will It End?
As the guy said in "Shakespeare in Love," "It's a mystery! My guess at where a pause could occur is 1525, but that may not stop this market. What I don't want to see is a reversal back below 1509.94, which was the 1-30-2013 high. Note that in the move above the lower green line on the chart, there were essentially three sideways moves, and the gains during the last three moves up on the daily chart have been quite small. Though not great, this may suffice as long as the momentum continues upward. I'll comment again on investor sentiment in this Sunday's newsletter (sign up free to the upper right). Sentiment actually supports a further rally in my opinion.
And truthfully, the SP500 could fall to 1495.02, the 2-04-2013 low and still recover. Below there, I believe we would see more damage. The top green line is 1514.96. A slight pullback below there won't be lethal perhaps, but there's been enough back-testing of the prior two mini-consolidations. Any drop below 1509.35 may cause a bigger pullback.
2-08-2013 SP500 Index Close: Another Breakout
As always, it's your money and your decision as to how you invest it.
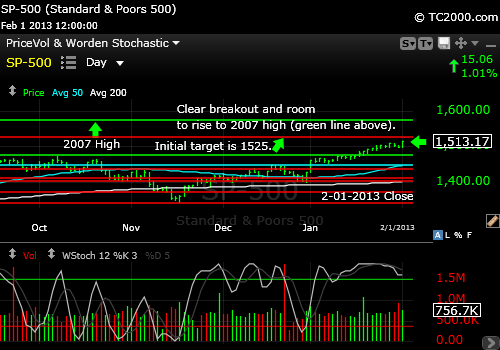
2-01-2013 Close: The Bull Run Continues
The breakout of the SP500 has continued to strengthen and my initial target of 1525 is nearby. It may be that we simply rise slowly with very minor corrections back to the 2007 high. We are at higher risk of a pullback than we've been before, although index valuations are not at extreme's yet. Sentiment actually has shifted very little over the past month. I discuss it further in the free report out out today! Subscribe via the link to the upper right.
2-01-2013 SP500 Index Close: Breakout Now Solidified
As always, it's your money and your decision as to how you invest it.
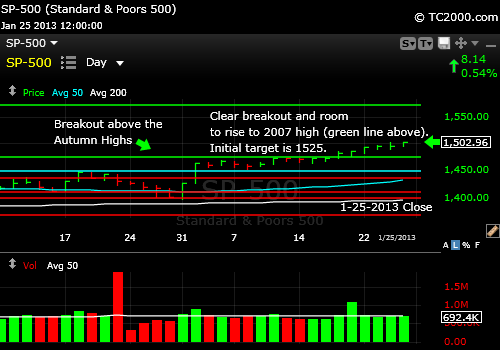
1-25-2013 Close: The SP500 Bulls Have a Big Breakout
The SP500 did in fact ignore a major apple falling from the tree of investor love last week, which was Apple (AAPL). The breakout is intact, and the next target with formation of a grand triple top will be the 2007 high. I do feel the market could hesitate or correct at 1525 before making a final charge up to the 2007 high and perhaps somewhat beyond that high, before reversing. When will this top occur? Read this week's free report by subscribing using the link at the top.
1-25-2013 SP500 Index Close: Breakout Now Established
As always, it's your money and your decision as to how you invest it.
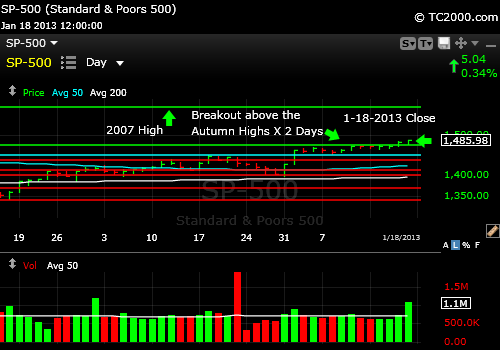
1-18-2013 Close: The SP500 Bulls Have the Ball
Last week I told you to watch that top green line and remember that it often it takes at least 3 days to cement a breakout. If we buy late, we risk missing part of the rally and if we buy early, we risk a reversal. Tough game eh?
If the breakout is confirmed, the 2007 high is within reach. We'll find out early in the week as earnings continue rolling in. So far the reaction has been OK, although not jubilant. The Intel earnings (INTC) did not seem to phase the overall market, although the 6ish% drop on Friday did slow down the NASDAQ 100 Index (QQQ) which failed to break out with the SP500 Index. The problem behind Intel earnings is the story of the slowing world economy, because the world literally runs on chips, so when chips don't sell, the world economy is hurting.
CONCLUSION: Don't bet the farm, and be willing to sell a reversal to preserve profits. My guess is that even if the breakout is sustained, it could reverse at around 1525, given the economic backdrop. If the world is really rapidly healing at this point and all systems are a go, then we'll retop at the 2007 highs. The Fed will then tighten the screws by raising rates and the market will correct once again.
As always, it's your money and your decision as to how you invest it.
1-18-2013 SP500 Index Close: Day 2 of Breakout
As always, it's your money and your decision as to how you invest it.
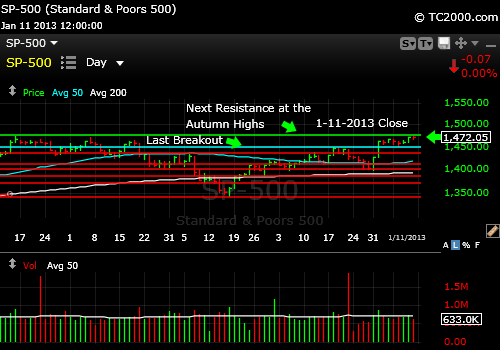
1-11-2013 Close: The SP500 has rallied a very small amount since last week and has failed to rise above the autumn highs. The real issue is earnings and the initial reaction is not entirely positive or negative it seems, as the market is up too little and not down enough to get a clear market reading on fourth quarter earnings so far.
Watch that top green line this week in the chart below and remember that a day or two above the line is not necessarily enough for it to hold the gains.
1-11-2013 SP500 Index Close
As always, it's your money and your decision as to how you invest it.
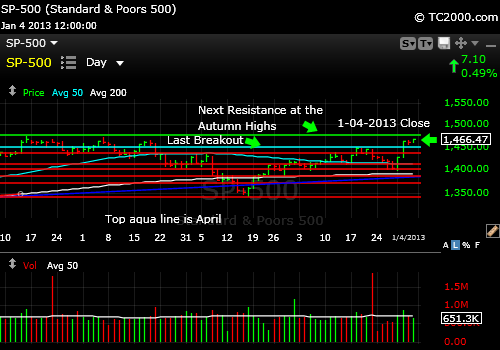
1-04-2013 Close: The SP500 has escaped the gravity of "the Cliff" and has rallied strongly as predicted. It now faces the resistance of the Autumn 2012 highs, but that does not mean it will stop there. The fact that unemployment was steady is good, though the retail numbers were softer than expected for the Christmas selling season. Retail stocks sold off toward the end of the year, but, with the market, have rallied back a bit. They are still lagging however and ours is a consumer economy.
So what will determine whether we will see yet another breakout? Earnings season with fourth quarter results and projections into the year will be the deciding factor. Watch the response. If the market goes up even in the face of bad earnings or soft projections, we'll go right up through the Autumn highs (resistance).
1-04-2013 SP500 Index Close
As always, it's your money and your decision as to how you invest it.
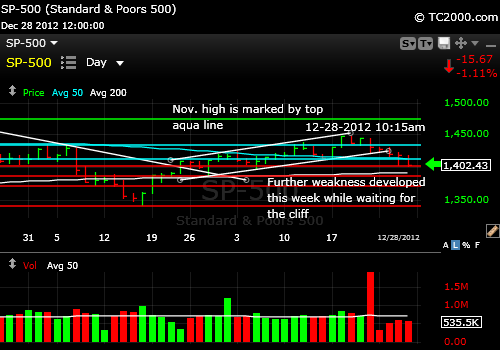
12-28-2012 Close: The SP500 Is "Cliff Bound" The usual expression is "range bound," but there is no range and instead, there is a down trend on the daily chart with some support right at the close on Friday 12-28, additional nearby support at the 200 day moving average, and a few other prior lows providing support below that as shown below in the chart. New technical weakness also includes a breach of the 50 day moving average on Friday.
"Cliff bound" means that there is risk of both non-resolution of the cliff as well as the risk of a Sunday evening temporizing resolution to the fiscal cliff, so named by Fed Chairman Bernanke, "Commander-In-Chief of Free Money."
The best way to trade this market this past week has been to put buy stops and sell stops in the market prior to speeches and scalp a few points here and there. That requires minute by minute attention of course, so for non-traders, despite the modest losses thus far, sitting on one's hands and maintaining some additional cash may be the best option. My portfolio is currently biased toward foreign markets which have been outperforming U.S. markets, providing a bit of a hedge. Of course when the selling gets serious, everything correlates with the U.S. markets, so foreign investments are not a perfect hiding place.
My guess is that they come up with some last minute face-saving compromise that will temporize the situation for a while and at least indicate to the markets that the full brunt of the cliff will not be felt head on! Watch the 12-05 low, which is next support. Below there, the next red line comes into play as support as shown on the chart.
12-28-2012 SP500 Close
As always, it's your money and your decision as to how you invest it.
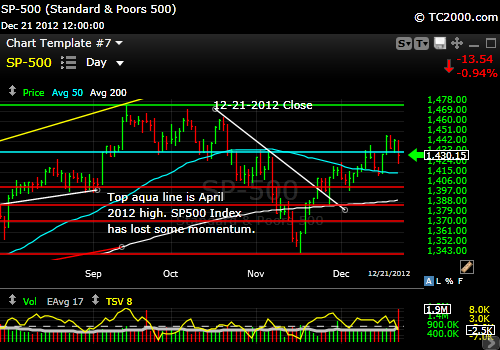
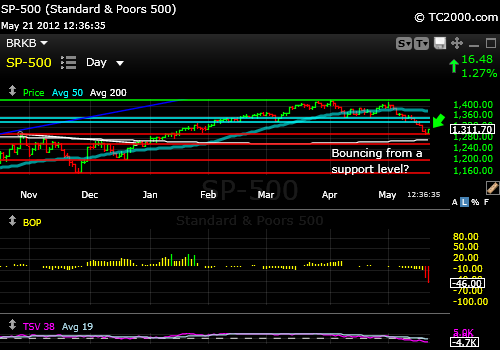
12-21-2012 Close: The SP500 has lost some of its momentum. You can see on the chart that we closed back below the early November high and this is the second failed breakout above that high, the other being the 12-12-2012 breakout attempt. The support below this level includes the 50 day moving average, the 12-14 low, and the top red line in the chart, which is around 1400. We are currently subject to both fiscal cliff resolution risk and fiscal cliff diving risk! Don't trade unless you are glued to the Congressional press conference updates this week. And call the local Congressional offices would you please? ;)
What's clear from the chart is that my original position that the SP500 would not stay over that November high until things were resolved in Washington was dead on despite the breakout on the 18th that has now failed.
12-21-2012 SP500 Close
As always, it's your money and your decision as to how you invest it.
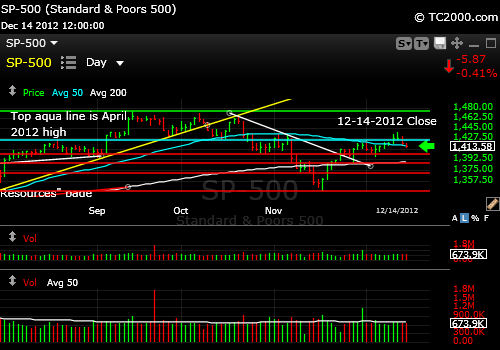
12-14-2012 Close: The SP500 first paused just below the 50 day moving average and then rose to our second target, which was the November high. I said that it would be unlikely to move higher than the latter target unless there was a resolution of the fiscal cliff in Washington.
Congress is staying over for most if not all of the Christmas holiday period, although I suspect we'll be paying for flights back and forth so they can have Christmas at home. We are paying for this? Amazing. CEO's across the country are livid as they are the ones forced to fire workers impacted by the planned cuts in government spending.
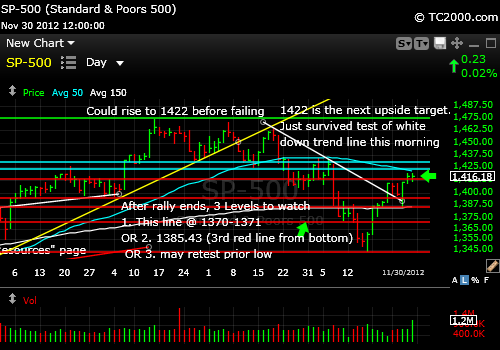
The two lows to look for are 1398.23, the Dec. 5th low and 1385.43, which was the Nov. 28th low. The next levels of support are 1370.54, which was the Nov. 9th low and 1343.35, the Nov. 16th low. One interesting formation that would allow a retopping of the market would occur if the 12-5-2012 low were to hold, because that sets up a reverse head and shoulders formation. The target for a breakout of that head and shoulders would be roughly the 2007 high. That would be the ultimate Bear killer.
There are Bears who argue that a resolution of the fiscal cliff would cause a big market sell-off. That could be for more than just "sell-the-news" reasons as discussed in this week's free report out on Sunday (sign up using the link on the upper right).
12-14-2012 SP500 Index Close
As always, it's your money and your decision as to how you invest it.
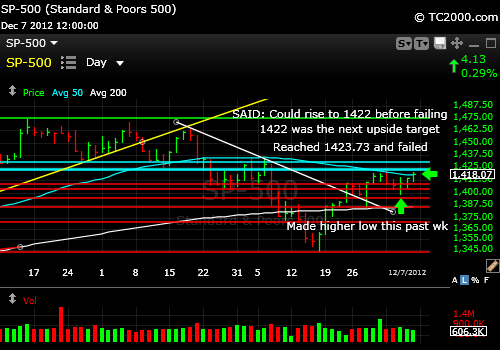
12-07-2012 Close: The SP500 was hesitating just under the 50 day moving average, and is now slightly above it, as shown on the chart below. The November high is within reach, especially given the higher low formed last week (see chart) and if that Nov. high is achieved, I expect the small caps (shown on the homepage) to come along as well.
Realize that markets commonly move slightly above key targets for traders like the 50 day moving average and then fall back. Given the lack of progress on the fiscal cliff, and that it now appears as though everyone is going home without a resolution, the market could easily be pressured with end of year tax selling, also known as "the rich folks cashing in their chips"!
It is because of this political backdrop that I'm not expecting a rally past the Nov. high until a resolution is reached. Check out the chart below to prepare yourself for this week's trading.
12-07-2012 SP500 Index Close
As always, it's your money and your decision as to how you invest it.
11-30-2012 Close: The SP500 is now hesitating just under the 50 day moving average as shown on the chart below. If there is one more push up to that level or just beyond it followed by a decline, the market will be set up for the next correction. Closing solidly above the 50 day moving average will allow for a re-topping at the November high or even the September high. Compare the position of the small caps on the homepage where I've posted the chart of the Russell 2000 Index (top of button bar to upper left).
11-30-2012 SP500 Index Close
As always, it's your money and your decision as to how you invest it.
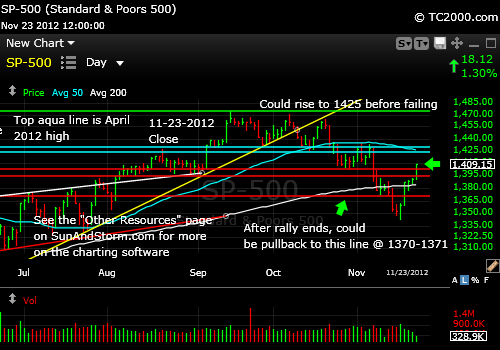
11-23-2012 Close: The SP500 has made some real progress and is headed to 1426ish at the 50 day moving average barring a rapid reversal on Monday. The holiday results thus far could support a further rally, but Europe has been throwing enough curveballs to pay attention prior to our open.
11-23-2012 SP500 Index Close
As always, it's your money and your decision as to how you invest it.
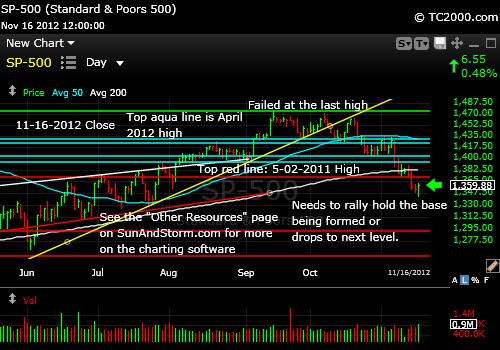
11-16-2012 Close: The SP500 Index has fallen enough that it is due a bounce, yet the summer 2012 lows are still calling. You can see below that there is plenty of room for a further fall on the chart, which means that bounces may be played by traders as places to exit.
The market got a bit of a lift within the range of the previous day due to some conciliatory comments made by both sides in the fiscal cliff discussion. They realize the public will not be amused to pay several thousand dollars of additional taxes come next year on an average family of four salary of about 50,000 simply because they cannot come to an agreement in Washington.
They need to move quickly to showing the substance of their agreement is fleshed out or the market will make still lower lows. Yes, it's that time again to call your members of Congress. Let them know you are watching them to see if they behave like adults or like your children.
The fact that the close was below the high from Thursday is negative and says we're in consolidation (moving sideways). The last move out of a consolidation was DOWN. The next one can clearly be UP due to the extent of damage done, but the failure to clear the Thursday high means another jerk down is not out of the question for Monday. All it would take is another round of unconscious blabbering out of Washington.
11-16-2012 SP500 Index Close
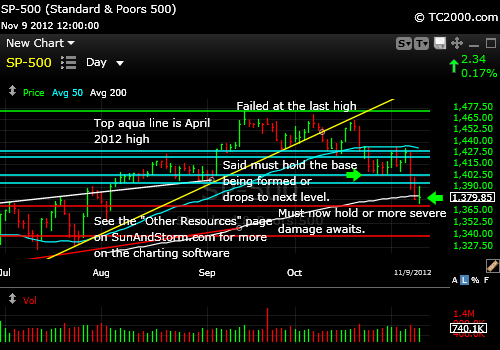
11-09-2012 The SP500 is in quite a different technical position than gold this week (see GLD tracking chart as well). It is now hovering around and seeking support from the 200 day moving average. It is a fairly good place to expect a bounce and if the current level does not hold, we'll descend to the lows of last summer. I did Tweet on Friday that I expected a bounce, but be sure to have a stop loss point in mind if you act on that notion.
As always, it's your money and your decision as to how you invest it.
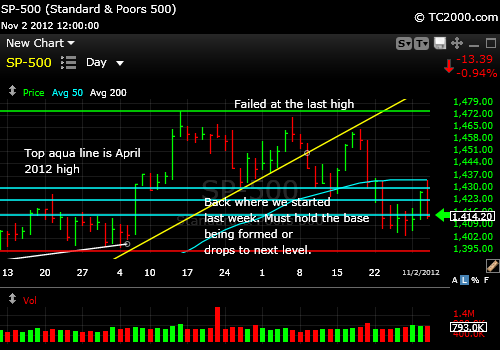
11-02-2012 The SP500 Index attempted a new breakout above the consolidation that I wrote about last week. It finished the week back in the consolidation it was mired in. The base of the consolidation (sideways move) must hold or down we go to the original target of 1396.56 which is the 9-4-2012 low. That low may fail because it's a bit too obvious. It could be breached to shake out a bunch of Bulls and then we could see a recovery back above the breach.
As always, it's your money and your decision as to how you invest it.
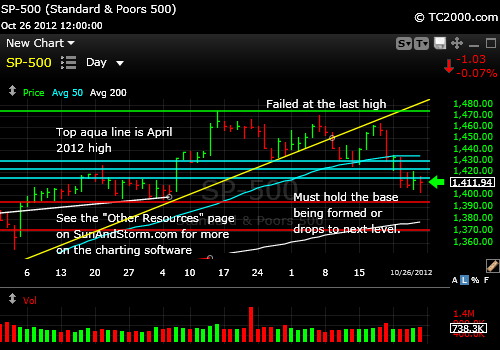
10-27-2012 There is likely more downside. The SP500 Index broke further below the 50 day moving average. The current consolidation (sideways move) must hold at its base or further significant damage will occur. I still favor a further drop to 1396.56 which represents the 9-4-2012 low. Since that level is obvious, look for a greater sell-off as a shakeout move.
As always, it's your money and your decision as to how you invest it.
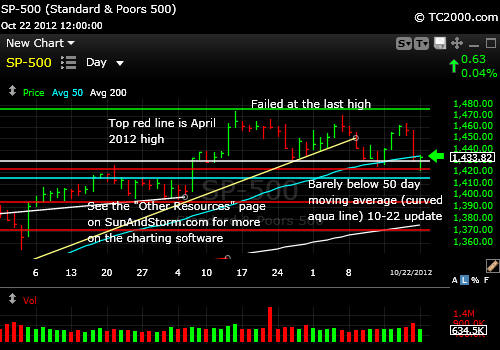
10-22-2012 The SP500 Index is around 50 day moving average support, actually slightly below it. There is some nearby support just beneath the close on Monday that could hold the index. Otherwise, I'd favor a further drop to around 1396.56 which represents the 9-4-2012 low.
As always, it's your money and your decision as to how you invest it.
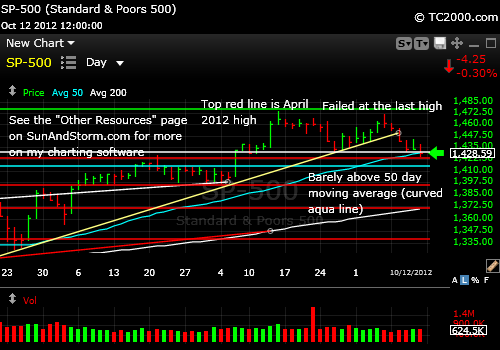
10-12-2012 SP500 Index Chart at close: Weakening but on Support The index is now just below the late September low and is barely above the 50 day moving average as shown in the chart below. The next test in a continued correction, if that happens, is 1420.38, the 4-02-2012 high. August support around 1396.56 would be next after that. Be sure to also check out the homepage and GLD charts for this week as well.
As always, it's your money and your decision as to how you invest it.
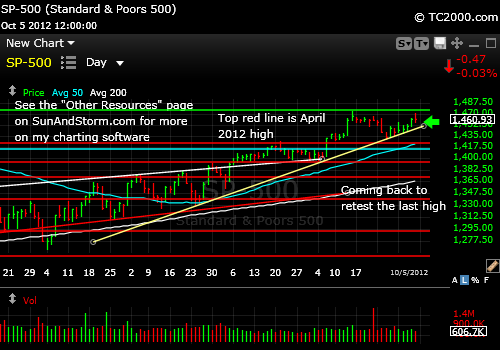
10-05-2012 SP500 Index Chart at close: The index has essentially re-topped. This sometimes happens in the course of a correction. The market tests various resistance several times, and if it does not make it through, the next logical direction is down.
This does not mean that the market cannot go to new highs before the next correction. With weaker earnings coming out, it all depends on how many bad surprises there are. If they are well managed by the big companies, then we may just continue to creep up in the vapors of Federal Reserve money printing.
I am rebuilding my long positions on strength as you've seen if you have followed Twitter this week Just click on the Twitter "button" to the upper right if you want to read the posts. They are also found on the right side of my "market timing blog" page.
As always, it's your money and your decision as to how you invest it.
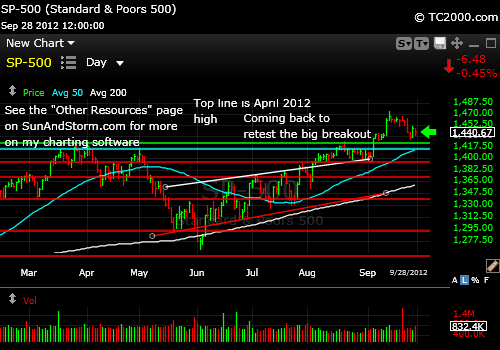
9-28-2012 SP500 Index Chart at close: The SP500 has now reached the base of the Bernanke breakout and threatens now to melt away the European Central Bank (ECB) breakout on 9-6-2012. The April 2012 high is the next support below that. I believe the 50 day moving average will be reached at a minimum in this downturn or perhaps the first red line below the current price on the chart below.
As always, it's your money and your decision as to how you invest it.
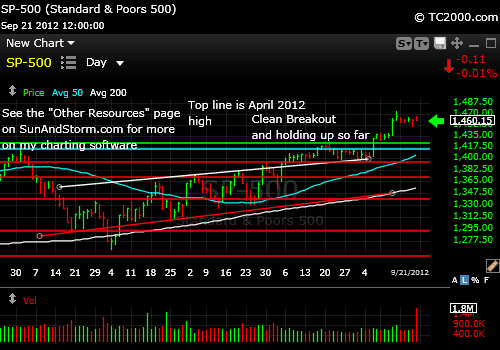
9-21-2012 SP500 Index Chart at close: The index has been levitating for the past few days. It has to either move up and out of this consolidation or we're in for a bit of a pullback.
The Treasury market is rallying, but it would actually be better to see yields rise a bit to indicate asset allocation into stocks. Of course, rising rates can also indicate inflation, so too much of a sell-off would not be taken lightly by the stock markets. See the homepage for the Treasury Note chart. And of course, please subscribe to the free weekly newsletter to read more. The link is to the upper right.
As always, it's your money and your decision as to how you invest it.
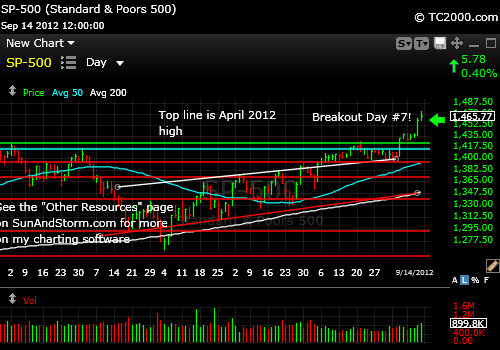
9-14-2012 SP500 Index Chart at close: The index sustained a breakout for 5 days and then took another giant leap up following the Fed announcement. The first jump up above the April 2012 high was due to the ECB statement saying they will buy bonds in "unlimited" amounts. Free money all over the world. Whoopee! Inflation here we come.
And on Friday, Egan Jones downgraded US debt once again this time from AA to AA-. The dollar is dying and the Fed does not care. It cares about driving up housing prices artificially and stealing from savers, who Dr. B says are better off because their house price will go up and so will their stocks. Older investors are taught by the "system" to put upwards of 70% of their money in cash instruments and bonds. The bonds are doing well, but not for long. You can see it in the bonus chart of the week on the homepage. Please subscribe to the free weekly newsletter to read more. The link is to the upper right.
As always, it's your money and your decision as to how you invest it.
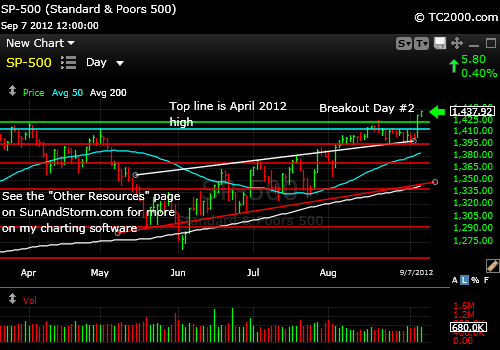
9-07-2012 SP500 Index Chart at close: The index has FINALLY jumped to a new high and faces immediate resistance at the 5-20-2008 high and then the 2007 highs. What a run after a massive fall. This week the SP500 Index cleared 1415.32 and then 1422.38, which was the prior high on 4-2-2012. Day 3 above the breakout point may be the charm the market needs to make it all the way back to the 2007 high. Please subscribe to the free weekly newsletter to read more. The link is to the upper right.
If you liked having access to the chart, could you please "Like" the page above and/or retweet it? Thanks very much.
As always, it's your money and your decision as to how you invest it.
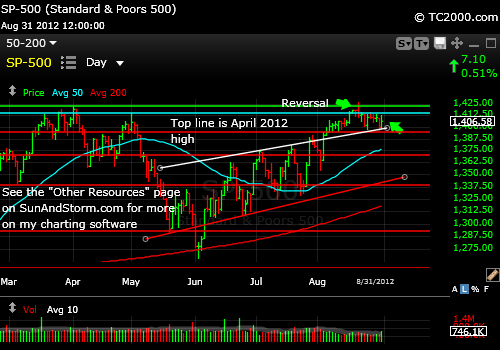
8-31-2012 SP500 Index Chart at close: The index has failed to make a new high of late, having pulled back from a failed breakout recently (see chart below). The SP500 Index was still having trouble staying above 1415.3 this week and that remains the immediate challenge for the market. Please subscribe to the free weekly newsletter to read more. The link is to the above right.
As always, it's your money and your decision as to how you invest it.
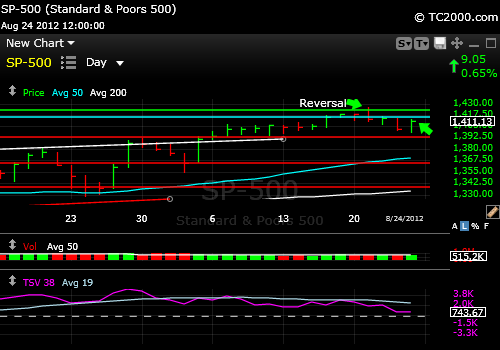
8-24-2012 SP500 Index Chart at close: The index has fallen back from a test of the April 2, 2012 high of 1422.8 where it failed to hold onto a new high. The 10 year Treasury Note chart will be the key to predicting the stock market this week as well as mentioned on the homepage. The SP500 Index is having trouble staying above 1415.32 today (Monday, 8-27-12). If we rise above there, we can easily re-top, but that does not mean a brand new high will be achieved. So risk is now much higher than the remaining upside reward. Please subscribe to the free weekly newsletter to read even more. The link is to the above right.
As always, it's your money and your decision as to how you invest it.
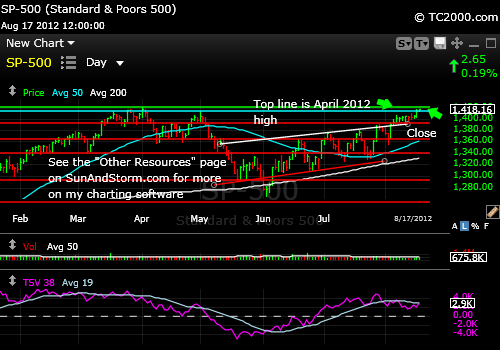
8-17-2012 SP500 Index Chart at close: The index has broken through the first layer of overhead resistance and is up against the top layer this week. It could end here, but the 10 year Treasury Note chart will be the key to predicting the stock market this week as well. If Treasuries rally now, the stock market will correct and the Bulls will lose the ball, which they clearly have had. Please subscribe to the newsletter to read even more. The link is to the above right.
As always, it's your money and your decision as to how you invest it.
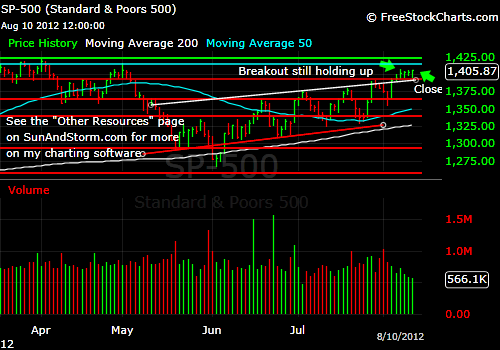
8-10-2012 SP500 Index Chart at close: The index has been creeping up and faces overhead resistance as shown in this week's chart. But watch the 10 year Treasury Note chart as shown on the home page this week (click the button on the upper left)! It will be the biggest "tell" on where the stock markets will head next. Please subscribe to the newsletter to read even more. The link is to the above right.
As always, it's your money and your decision as to how you invest it.
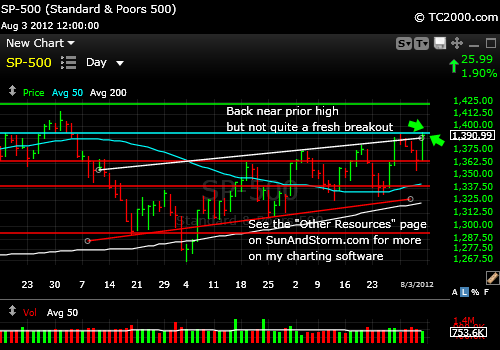
8-03-2012 SP500 Index Chart at close: The index was reinvigorated by the sense that the Europeans will now follow through to save the Euro currency. But watch the 10 year Treasury Note chart as shown on the home page this week (click the button on the upper left)! It will be the biggest "tell" on where the stock markets will head next. Please subscribe to the newsletter to read even more! The link is to the above right.
As always, it's your money and your decision as to how you invest it.
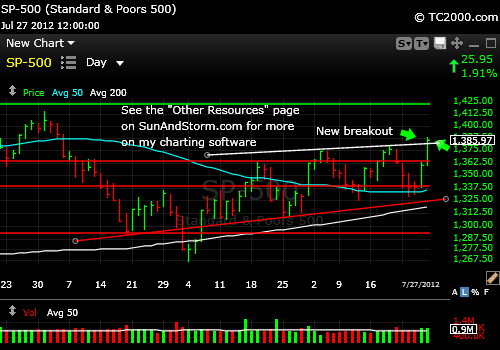
7-27-2012 SP500 Index Chart at close: The index pulled back as expected and after I noted the similarity of the pattern to the prior two pullbacks and reported it on Twitter, we bounced right on schedule. Now we could have stopped dead at the prior highs (triple top discussed last week; see below), but we did not in fact stop there. So we have a breakout for the Bulls to munch on this week. If it reverses, watch out below, but now the pressure is on the Bears. I'll give you a little more guidance than this in this week's free issue, so please subscribe to the newsletter to read even more! The link is to the above right.
As always, it's your money and your decision as to how you invest it.
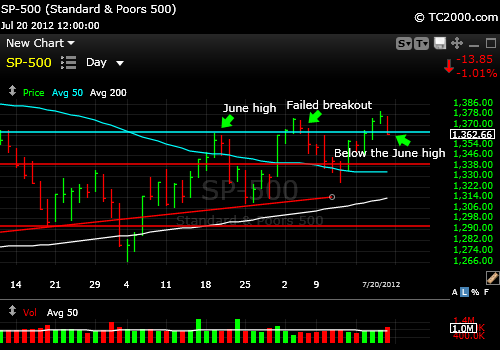
7-20-2012 SP500 Index Chart at close: The index has now reversed a triple top. This is not good for the Bullish case. It is at least worth a mild pullback to one of the support levels reflected by the lines beneath the current price on the chart below.
As always, it's your money and your decision as to how you invest it.
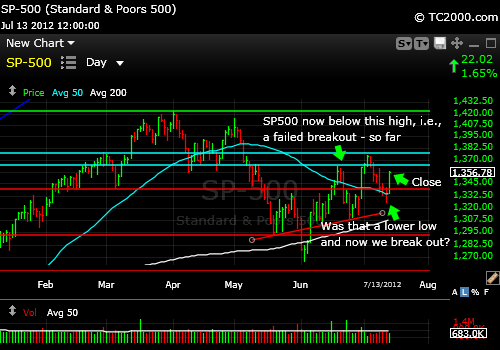
7-13-2012 SP500 Index Chart at close: Despite the failure of the prior breakout, the index has now made a higher low. That much the Bulls have. There is immediate overhead resistance shown by the two aqua horizontal lines. There is Fed testimony next week that could strongly impact a market that seems to believe that the Fed will be loose with its money come the August Fed meeting. If they do take action, the election will go to President Obama as the stock market will likely continue to rally. Does the Fed want to have that sort of influence? I'll let you answer that one!
As always, it's your money and your decision as to how you invest it.
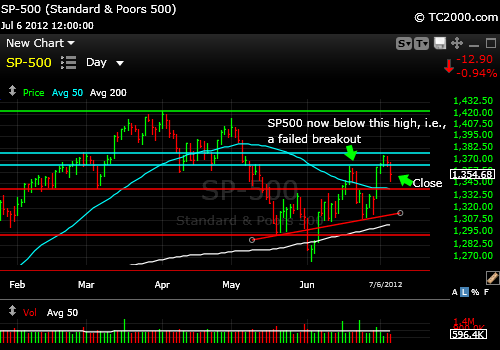
7-06-2012 SP500 Index Chart at close: There has been a reversal below both the May 2011 and the July 2012 highs. The Bears have the ball. The 50 day moving average and the June lows provide some support, so it is not an obvious sell here (see chart). If you have not seen them, the metals are drooping as well: GLD ETF Chart
As always, it's your money and your decision as to how you invest it.
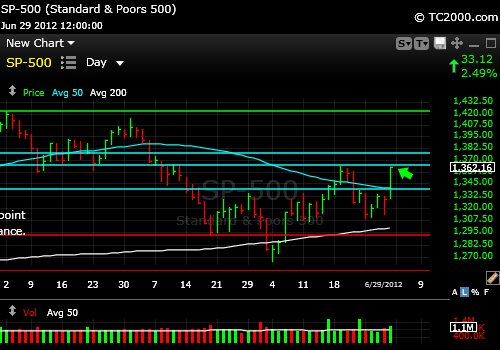
06-29-2012 SP500 Index Chart at close: Last week I wrote: "For the Bears, this would be the perfect place for the market to continue downward to the May 21st low of 1315.99." We in fact tested just below there at 1309.27 and bounced. The SP500 Index made it over the March 2012 low and is now challenging resistance as the chart shows below. There is much more in this week's newsletter (link to upper right).
As always, it's your money and your decision as to how you invest it.
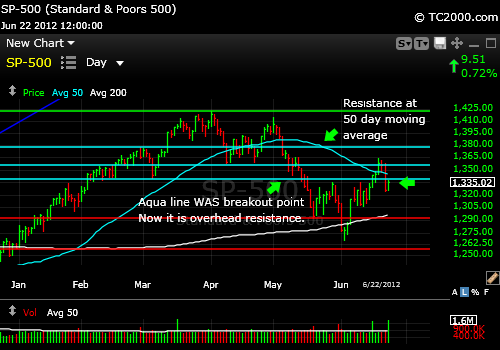
06-22-2012 Chart at close: The SP500 Index dove with the metals after the Fed disappointed Wall Street with too little money dropping from their helicopters. The index is now below the March 6th low, but just barely above the May 29th intraday high. The Bulls will have to close the index above the March low to prove themselves. For the Bears, this would be the perfect place for the market to continue downward to the May 21st low of 1315.99.
As always, it's your money and your decision as to how you invest it.
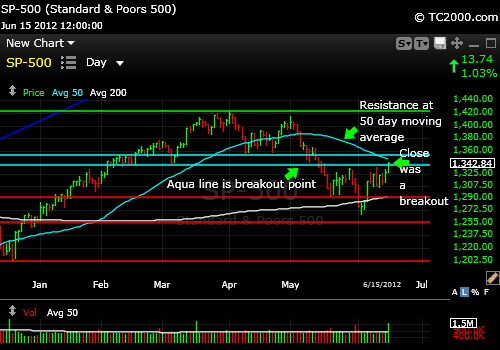
06-15-2012 Chart at close: The SP500 Index has now rallied above the 6-11-2012 high and over the 3-06-2012 low as well. It was impressive that it happened with the Greek elections pending. Sometimes the market won't budge until the uncertainty clears, so the behavior is very positive. The next resistance is at the 50 day moving average just above the close on Friday and the aqua lines above that on the chart below, which marks the 4-10-2012 low. Before that the 2-29-2012 high represents a bit of resistance as well (1378.04). Then the 5-1-2012 high is next major resistance, then the top marked by the green line.
The point is to witness the behavior of the SP500 Index at each point of resistance for possible failure. A reversal back below 1334.93 would be negative and would likely result in at least a retest of 1292. I believe last summers lows could come into play if the S&P500 Index goes that low.
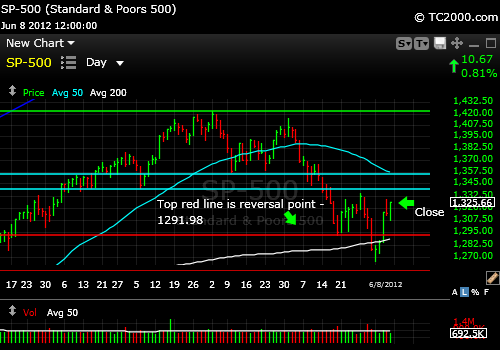
06-08-2012 Chart at close: The SP500 Index rallied hard on Wednesday and then failed to make it back above the prior high. That is the key resistance point along with the March 2011 low. It is unlikely that the market can get past resistance without further central bank action. Further details in my free weekend report. Subscribe via the link to the upper right.
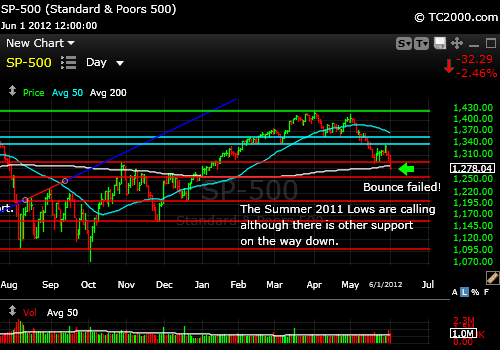
06-01-2012 Chart at close: The SP500 Index failed at the base of the consolidation this week (sloppy sideways to slightly up pattern in this case). The chart is now broken. Further details in my free weekend report. Subscribe via the link to the right.
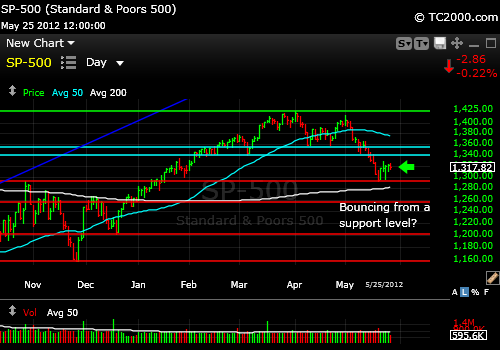
5-25-2012 Chart at close: The SP500 Index could bounce from here given the sideways move (consolidation) this week. Further details in my free weekend report. Subscribe via the link to the upper right.
5-21-2012 Chart at 12:36 pm ET: The SP500 Index could bounce from here or after one more whoosh down as discussed in further detail in my free weekend report. Subscribe via the link to the upper right.
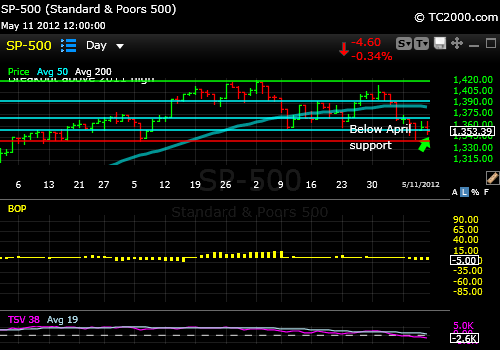
5-11-2012 Chart: The SP500 Index was back below support at the end of the trading week. Negative and suggests further downside as noted in further detail in my free weekend report. Subscribe to the upper left.
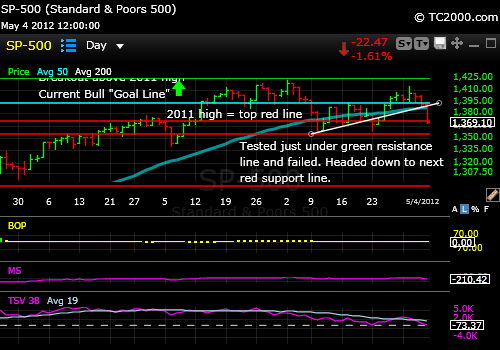
5-04-2012 Chart:
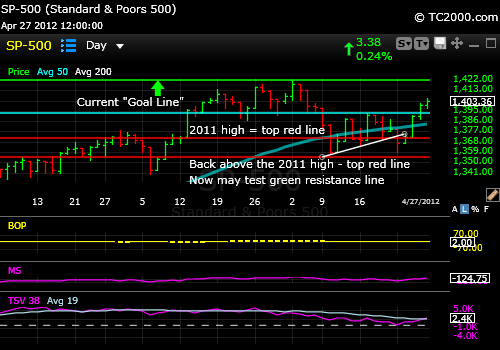
4-27-2012 Chart:
4-20-2012 Chart:
4-13-2012 Chart:
4-05-2012 Chart:
3-30-2012 Chart:
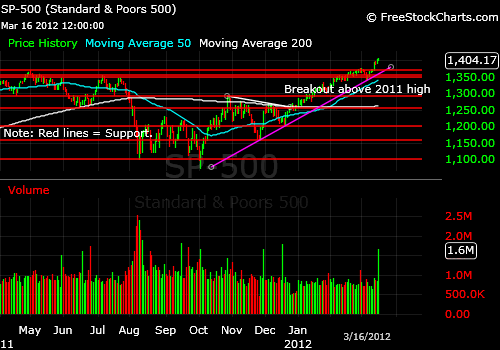
3-16-2012 Chart:
3-09-2012 Chart:
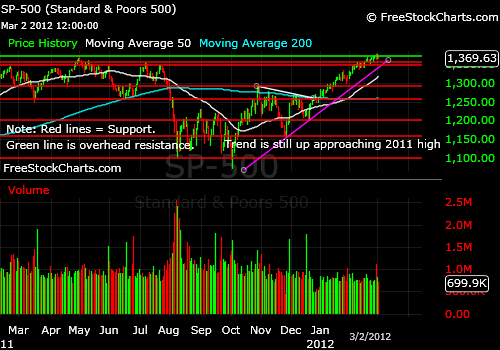
3-02-2012 Chart:
Updated 01-08-2012: This is the SP500 Index Video timing newsletter for the market week ending on 01-06-2012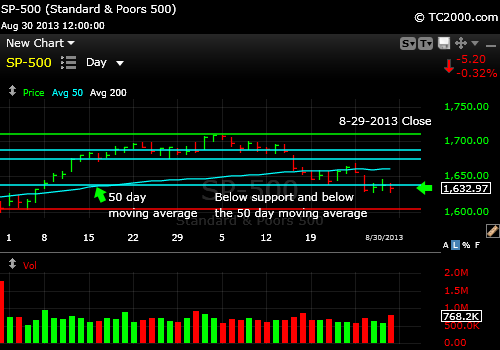
06-02-2013: More Downside Ahead
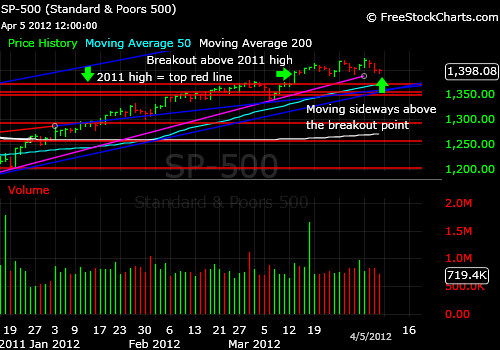
04-05-2013: The SP500 Held Support This Week but Reversed a Breakout
3-23-2012 Chart:
You can expand the video to full screen view by clicking on the Box with the 4 outwardly pointing arrows in the bottom right of the video box below. Hit the escape key to exit the full screen mode. If you are using Firefox, you must have the Adobe Flash Player Plugin for Firefox installed or you will see a blank space below. Please subscribe to the right ("Free SP500Tracker™") to be notified of the next video and to receive my "Tips" beyond the SP500 Index.
1-5-2012: Subscribe to my free newsletter here to read my latest take on all 35 indices:
For My Latest Market Timing Signals
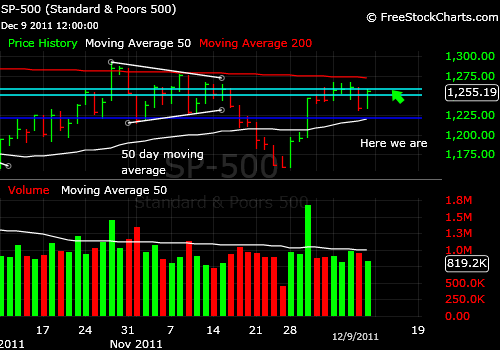
Updated 12-11-2011: This is the SP500Tracker™ Newsletter for the close on 12-09-2011: The SP500 is in recovery, now above the March 2009 low, but below the June 2009 low(aqua lines below). Just above here is resistance at the 200 day moving average. The market had failed a breakout at the 200 day moving average on 10-31-2011.
A further rally in the SP500 Index is predicated upon further follow through by the Europeans in getting their fiscal house in order as mentioned in the prior video (below). There are some who feel that the solution they came up with may help in the future but is not sufficient in magnitude to handle what is going on currently. If this impression spreads through the markets early in the week, we could see further weakness.
Follow the news flow, but also watch how the SP500 behaves if and when it hits the 200 day moving average again. If it goes through and closes above there, the Bulls have the ball and may keep it up through Christmas at least. January could be another ball game.
Have a look at the SP500 Index market timing chart below produced using Worden Brothers Charting Software (see disclaimer on "Other Resources" page:
For my latest comments on the Gold Market:
Market Timing Gold (GLD ETF)
11-29-2011 - Important Note The stock markets including the SP500 Index are going to turn upward even more strongly than we've already seen early in the post-Thanksgiving week as soon as the world actually comes up with a European solution. That means there is risk both in selling and in holding stocks at this point. The world must act now to stem the collapse of the stock markets. WHEN it acts will determine the ultimate low we reach. If you are selling late, please record a decision and email it to yourself as to where you will re-enter the market. Having no plan is the worst mistake investors repeatedly make. This IS 2008 all over again, despite what the press has told you, another liquidity crisis in the making requiring massive intervention on the part of the world's governments.
UPDATE 11-29-2011; 2:04 pm ET: The SP500 Index rallied on Monday due to happy talk from Germany's Merkel and the strong Black Friday sales. I mentioned on Monday that the best course was likely to see how the market opens before making firm selling plans. One approach would be to follow the market up with a stop with a bit of leeway. I would continue with that approach. Closing over the 50 day moving average is the next hurdle for the SP500 Index. Even if that happens, the market could be stopped at a somewhat higher level, for example, at the down trend line formed by the two prior highs on the daily chart. Right now that line is at 1224-1225. A close above there could bring the SP500 Index back to the October high for a retest. And then with slowing sales in the first quarter, the market could start selling off at the beginning of January.
The thing to be aware of is that Europe represents a potential tinder keg in case of fire. Translated that means that if a European bank fails, all bets could be off for the now possible Santa Claus rally as it is often called. When is the optimal time to buy? I actually checked going back to 1995 when Bill Clinton was running things.
When will the Santa Claus Rally come to town this year?
These were the optimal days to buy:
1995: 12-18
1996: 12-16
1997: 12-26
1998: 12-14
1999: 12-08
2000: 12-20
2001: 12-13
2002: 12-27
2003: 12-10
2004: 12-07
2005: 12-30
2006: 12-01 (better if bought 11-27)
2007: 12-11
2008: 12-01
2009: 12-08
2010: 12-01 (better if bought 11-30)
2011: ???
The returns for such purchases were wide ranging from nicely up and being a part of a longer rally to small blips up before significant declines. In the case of 2008, the massive 2009 decline to the 666 low in the SP500 Index follow the brief holiday party. From my reading of the data above, given the current sloppy political backdrop, I'd favor some chop in the markets such that the optimal buying point might not come until Dec. 7th to mid-month. Guess when the European Union is holding their meeting? December 8-9. So a dip into that meeting is a distinct possibility. That said, note that there were three data points over the past 15 years where the correct day to buy was 12-01 or even by the 27th of November in 2006.
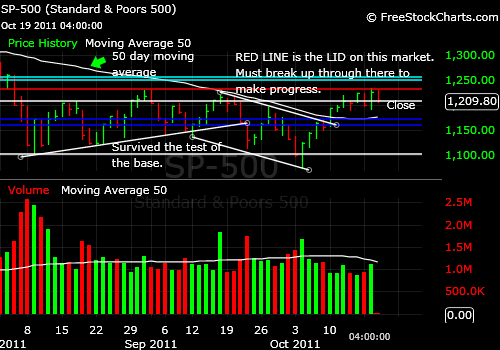
11-07-2011: The SP500 Index is waffling around that 1249.05 number. I like to say the "market is playing with my number." What that means is that I intuited from examining the chart where an important pivot point could be. When the market goes slightly above it, then slightly below it and for example, last night, when the futures trade almost exactly down to that number, I know that the number is "my market timing number." The market action tells you outright. The failure to move up through this number definitely means there is no point in buying here. It could turn into a pivot point for a correction of unknown size.
At the same time, there is no confirmed sell signal here either for the SP500 Index. That means we are at a pivot point, waiting for a resolution. Europe is front and center as the emotional "cause" of this lack of conviction by the market, but perhaps it's also an excuse, considering the ineptitude in our own government in dealing with both the economy/jobs as well as our debt crisis.
We are not so far behind Italy, Greece and the rest in owing far too much. If the debt solution does not come to fruition from the super-committee, our credit will drop another notch and the entire system will shudder. We'll be back below the prior lows in a heartbeat.
That said, I'm not selling until I see the whites of their eyes. In market timing terms, I have to have the market tell me I was wrong to be buying on the way up in this rally first. Then I'll be a seller of the SP500 Index again. (As for gold, check my Tweets either on the right side of my market timing blog (button to left near top) or on Twitter. Gold is acting well.)
If you liked this post, please "like" the page above and/or retweet it. Some of you have done this, so thank you. Other writers know this, but some of you may not. We work in relative isolation from those who read what we write. If you don't say you like it or retweet it, there is no way to know that what we write matters to you. My suggestion is to not just do it on this site, but to do it on all sites you visit and enjoy. If you received, please give (by scrolling down a bit to the feedback section below the video). And thank you.
11-03-2011: Watch the SP500 Index at the 1249.05 level today mentioned in the video below (the 3-16-2011 intraday low). The market has moved above that level at the open but is now back below. If it cannot hold there, there is no point in adding to most stock positions. Wait for a pullback.
Theoretically, the Euro rate decrease should strengthen the dollar and weaken gold in dollar pricing (would go up in Euro pricing), but that is not what is happening so far today. Gold has rallied as the "last currency" on the planet that won't be degraded by governments.
In terms of the Euro zone economy, the rate decrease should make Europe more competitive as long as the money that is made available through those lower rates is being used to stimulate growth. Also, by weakening the Euro, European product prices go down vs. the US dollar and US multinationals should give up business to European counterparts. This of course would support the Euro currency with increased money flows to Europe.
If you appreciate this comment, please like the page below. As always, it's your money and your decision as to how to invest it.
10-28-2011: My latest comment on the markets: Market Timing this Rally
10-20-2011: Tonight's market timing commentary is here: Market Timing Brief
10-19-2011: The most recent chart update and Tracker Video is below.
Have a look at the SP500 market timing chart below produced using Worden Brothers Charting Software (see disclaimer on "Other Resources" page:
Follow me on Twitter for further comments (button is on upper right to follow my comments).
And if you liked the report, could you please "Like" the page below and/or retweet it? Thanks very much.
For my latest comments on the Gold Market:
Market Timing Gold (GLD ETF)
*****Free Two Week Trial
While the Market Is Uncertain Take the trial, risk
free! "SLOW SIGNAL" for SP500***: BUY
*** Note: The slow signal is generated in such a way as to trigger more slowly as a market turns either from up to down or from down to up. If you invest or trade only based on the slow signals, you will give up more as the market turns down and turns up. That is, you will tend to sell later and buy later. The strongest markets are of course those that are in double BUY or double SELL mode
in regard to both short to intermediate and long term signals.
The best use of the information
in the SP500Tracker™ Newsletter as well as the regular Wall Street Sun and Storm Report™ is to use it in a way that works for you and that fits with your investment philosophy.
The disclaimer of this website applies, so please read it using the button near the base of the blue Navigation Bar to the left. Please discuss any information on this site with a financial advisor as needed prior to investing as it's your money and your decision as to how to invest it.
The charts were produced by FreeStockCharts.com which is a registered trademark of Worden Brothers, Inc., Five Oaks Office Park, 4905 Pine Cone Drive, Durham, NC 27707. Ph. (800) 776-4940 or (919) 408-0542. www.Worden.com.


