Market Timing Blog for
Sun and Storm Investors™
FREE Password Access and ETF Investing "Tips"
NOTE:Comments on my market timing blog and on Twitter often refer to intraday moves, so please to not trade if you mean to invest. I also discuss targets for intermediate and long term investments. Remember that it's your money and your decision as to how to invest it.
Please go to the following LINK for my LATEST COMMENTS and feel free to leave your own comments!
My Latest Comments
My blog entries are sent via Twitter under my Twitter name "DavidBDurandMD" (button is below) and can also be accessed by subscribing to the WordPress blog by simply clicking on the subscribe button when you are there. They'll send you an email for each post, so you don't miss any.

If you want to find all the latest articles on the site, the links are all on the "Read My Feed Page HERE: Latest Articles and Publications
The following are archived comments and charts, which may give you some insights. My current blog posts are here: My Current Blog Posts
All charts were produced by FreeStockCharts.com which is a registered trademark of Worden Brothers, Inc., Five Oaks Office Park, 4905 Pine Cone Drive, Durham, NC 27707. Ph. (800) 776-4940 or (919) 408-0542. www.Worden.com.
SUN AND STORM INVESTING™ MARKET TIMING BLOG on
01-03-2011 10:57 am:
At 1274.41, the S&P 500 index MAY trigger another market timing BUY signal by the close today. Realize that this breakout comes at a time during which sentiment is at an extreme high. This goes for the sentiment that Mark Hulbert tracks in his watch of newsletter writers and well as that of the individual investor sentiment such as AAII's. I'll be reviewing the data soon, but let's just say, there are too many Bulls and not enough Bears generally speaking to support a big rally here or to avoid giving up the gains of a rally should it occur from here.
That means your risk may now be higher if you buy. It does not mean you should not buy into this breakout, but it does mean you have to treat it more like a trade than an investment due to the stretch in sentiment.
FOR A VALID BREAKOUT, The CLOSE has to be above the recent consolidation area, not just the intraday value. This breakout could be reversed after one or two days, so you should consider keeping a tight stop on all new positions taken here. I would potentially add at the close but have a stop below which I would sell if the breakout fails and I would personally not allow more than a 2% loss or so on a new position taken here, but it's best if you make that decision yourself based on your own investment philosophy/strategy.
My SP500Tracker™ newsletter is out and can be accessed for free by subscribing here:
To see where a reversal would occur on the SP500 chart: Subscribe for FREE to the SP500Tracker™ Newsletter
Remember that it is your money and your decision as to how to invest it.
SUN AND STORM INVESTING™ MARKET TIMING BLOG on
12-30-2010:
Here are the latest Blog entries:
Gold and silver should represent a minimum of 5% of your total assets in my opinion. You could easily hold more at this point in history considering the risks of our currency. Whether you use market timing to trade a portion of your holdings is up to you. I lay out my insights into the risks and benefits of owning both of these precious metals and why they are different here:
Golden Advice
SUN AND STORM INVESTING™ MARKET TIMING BLOG on
12-21-2010:
Here are the latest Blog entries:
The housing stocks have a lot of room to the upside. When you approach sectors like housing that truly "stink," hold your nose and buy.
Housing Explodes (no worries, not houses, housing!)
SUN AND STORM INVESTING™ MARKET TIMING BLOG on
12-21-2010:
Here is a tip on the SPY and how you can miss a breakout or believe there has been a breakdown in an index and be 100% WRONG! This morning the SPY SP500 ETF was below the 125.23 level so it had not yet broken out on the chart. OR had it? The underlying index, the S&P 500, had broken out in market timing terms but not the SPY ETF, because it is "ex-dividend" today. So it is down slightly due to the distribution of that dividend.
This means that an index does not have to trade exactly parallel to the funds that follow it. You can go to a site that tracks dividend distributions to find out these dates. Enter "dividend investor" into your favorite search engine and you'll find the info you need.
SUN AND STORM INVESTING™ MARKET TIMING BLOG on
12-20-2010:
Here are the latest Blog entries:
The SP500 is attempting a breakout today. If it does make it to a new recent high, the Bulls will have more fuel potentially. But if the surge to around 1250 this afternoon fails, it may be a time to go "passively short" as I coined the term. Read more here:
How to go "Passively Short" from here - An Update
I have also just published this weekend's issue of the SP500Tracker™. You can view the prior week's copy and then sign up for this week's here:
SP500Tracker™
SUN AND STORM INVESTING™ MARKET TIMING BLOG on
12-10-2010:
Here are the latest Blog entries:
The AAII Investor Sentiment Survey is out. It suggests the market COULD stall here. That does not mean you should sell everything, but you may want to set some stops and/or take some profits.
Read more here:
Sentiment Survey SAYS!
SUN AND STORM INVESTING™ MARKET TIMING BLOG on
12-07-2010:
Here are the latest Blog entries:
The SP500 has weakened a bit and may or may not fail this retest. Set your stops! Read the forum page (follow the links below) to keep up to date. And sign up for the free SP500Tracker™ newsletter.
2010-12-07-SP500-ETF-Market-Timing-Signals-SPY
I discuss the failed breakout in GLD and GDX today. This could present another buying opportunity in a few days or weeks.
2010-12-07-You-Better-Not-Cry-Gold-etf-Market-Timing-Signal
SUN AND STORM INVESTING™ MARKET TIMING BLOG on
11-22-2010: 3:24 pm ET
Is this Gold's (GLD) Time to Shine Again? A Market Timing Breakout?
The GLD has reached support and today has moved up slightly above the area of consolidation (sideways price movement) of the past several days. Look at the GLD chart on Yahoo Finance or elsewhere and you'll see we are now above the 132.78 high of 11-18-2010. As long as we close above there, the signal will be confirmed. I'll have more details for subscribers tonight on the next two buy signals. Timing your scale in points in the market is critical to reducing risk. You can subscribe for just $8.95 a month. This single gold trade could make you many times that minimal investment. I cannot give it all away as that would be unfair to those who value what I do and profit from it. If you would like to subscribe on a 2 week trial basis, GO FOR IT! Click the SUBSCRIBE button on this page:
Subscribe to get ALL my critical GLD Trade Numbers
SUN AND STORM INVESTING™ MARKET TIMING BLOG on
11-18-2010: 2:20 pm ET
Update on Market Timing the Euro Short!
The Euro short has set up a reverse head and shoulders on the 5 minute chart. The break point is at 136.13. It it prints there, the Euro should fall to around 1.3575 based on the reverse head and shoulders formation. A print at 1.3573 could bring us to 1.3508 to start with. I believe there may be more downside, but it's best to let the trade unfold and reevaluate along the way.
For this trade to work (you can use EUO, UUP, or short the FXE or of course go the Forex route if you wish), I would like to see the FXE stay below about 136.22. It is currently at 135.71. The Euro itself should stay below 136.74 optimally.
Due to the possibility of intervention, you should not "bet the farm" on this. Be conservative and use stops. If this is wrong, it's wrong and that is fine. You must preserve capital as much as possible without running from every blip up while the decline is underway. If you own stocks, metals, etc. they will likely DECLINE if the above Euro scenario plays out.
(11-19-2010 NOTE: I HAVE ALREADY UPDATED the subscribers of my FREE "Tips" newsletter tonight in regard to the US Dollar / Euro Trade early this morning. Scroll down a bit and sign up at no charge. You will receive the password very quickly. Then press the "Tips Access" button on the blue Navigation Bar on the home page (and most other pages, but homepage SunAndStorm.com will work). Enter the FREE PASSWORD to enter. I am a physician who understands privacy. Your email address will never be shared Please scroll down a bit and enter your email address and press SUBMIT.
SUN AND STORM INVESTING™ MARKET TIMING BLOG on
11-18-2010: 8:48 am ET
Time to Short the Euro Again?
I wanted to get this one out quickly: If you were looking to get short, this is probably the place. 1.3691 should hold it on upside. That stop would give you a 0.373% loss and if you then allow for some leeway on getting out of your position you only risk 0.5% with a lot more to gain if the Euro moves lower. The minimum upside is probably a fall in the Euro to about 1.3340 from 1.3642 right now or 2.26% vs. 0.5% loss or 4.46:1 Reward:Risk. And that assumes only a modest pullback from these levels. If you use EUO you will double it roughly, but only if it moves down quickly. Remember that you lose a bit due to the fact that time in any double or triple negative costs you (please read the prospectus!). The ETFs rebalance daily and take the time loss into account.
Yes, the risk is that they "solve" some of the problems in Europe, but the EU wants the US dollar higher and I think that will help this trade along, even with the counter rallies. Use a tight stop and you have a great reward:risk setup here.
You can check out the charts for yourself on a site like DailyFX.com. Look for EUR/USD for market timing of the Euro vs. the US Dollar.
Realize that paring back your stocks and metals positions on rallies could also be a way to play this, so if you are not comfortable with currency trades, reduce your stock and/or gold exposure. I would not recommend dropping your long term gold holdings. I am talking about trading positions. If you would like to get my latest updates, including my soon to be released and FREE SP500 market timing newsletter, sign up in the box below. Please scroll down.
SUN AND STORM INVESTING™ MARKET TIMING BLOG on
11-15-2010: 4:40 pm ET
Is the US Dollar Rising from the Dead?
The US dollar has reached the targets mentioned in my last blog entry. The current value of the US dollar index is 78.64 which is above the prior closing high of 78.36 as well as above the intraday high of 78.48. This means the rally is now reliably under way according to market timing signals.
This is very bad news for stock market Bulls as the inverse correlation of the US dollar with everything else is well known. And interestingly enough, the Treasury market has been selling off, which is also very bad news for stock AND bond holders. Higher interest rates increase the cost of money for companies and raise their costs and bond holders lose capital gains they have accrued since the 2009 low in bonds.
CONCLUSION:The US dollar index has now entered a sustainable rally, likely of intermediate term duration. A reversal from this point would have to be respected, but I do not think that the move thus far is enough. Why? Because there was a recent bottoming formation in which the US dollar index went through support and then has since recovered above that support.
The US dollar index also has come up from a long term trend line connecting the last major low in 2008 with one in 2009 and the most recent low, where there was, once again, a false breakdown and a recovery.
All this is Bullish for a more serious US dollar index move that can be played with 2X leverage with the EUO, as the Euro should sell off from here with the full support of European leaders. Or you can trade the dollar index using the UUP which goes up with the US dollar. (NOTE: The UUP may cause some tax issues in IRAs, although your broker may even file the forms for you; but you may want to investigate further beforehand.)
European leaders WANT their currency to start failing so their goods will be more competitively priced. There is nothing like having the government ON YOUR SIDE during a trade.
SUN AND STORM INVESTING™ MARKET TIMING BLOG on
11-08-2010: 3:57 pm ET
What Kind of Strength in the US Dollar Would Drive Stocks, Gold and Everything Else DOWN?
The US dollar index started to perk up on Friday coming off a low and moving back above the 10-15-2010 low on the close.
In the overnight market it made it back above the 76.71 market timing number I wrote about on the "Market Timing Forum" page and now the next hurdle would be a close above the market timing signal point of 76.98.
At 77.04 at 4:01 pm, it's cutting it kind of close. It clearly must prove it can move up from there to have cleared this hurdle. If it does, the dollar index could easily move to the 78.36 high and then back to around 79.

Chart courtesy of Worden
Brothers, Inc. at FreeStockCharts.com.
In the meantime, EVERYTHING else but Treasuries would then come down. I know many investors don't like to hear that, but even the most Bullish investor must realize that a correction is becoming more and more overdue.
SUN AND STORM INVESTING™ MARKET TIMING BLOG on
11-05-2010:1:56 pm ET
What to Do About the Gold (GLD) and Silver (SLV) RUSH?
I just wanted to make a quick comment about the gaps appearing in the GLD and SLV charts as investors have closed out short positions and/or rushed into these two metals over the past two days. Gaps in both GLD and SLV are often filled, meaning the market tends to come back down to fill the gap between the high on the prior day and the low on the day of the "gap up." (See chart below)
This means that if you intend to scale into the metals rally, you may not want to blow all your capital with one purchase. Going in stepwise and buying the pullbacks would likely reduce your risk. Will you give up opportunity? You could, but generally when investors are rushing into ANY investment after a healthy run up, there is often a retracement of those last "rushed" gains.
 Gap May be Filled")
Chart courtesy of Worden
Brothers, Inc. at FreeStockCharts.com.
SUN AND STORM INVESTING™ MARKET TIMING BLOG on
11-04-2010:10:08 am ET
Sentiment is Risky Now:
AAII Survey Analysis for 11-03-2010
Read the above post to catch up on how optimistic investors have become. And how few Bears are left in the woods.
SUN AND STORM INVESTING™ MARKET TIMING BLOG on
10-15-2010:2:38 pm ET
REITs Could go Either Way
REITs are back up at the late April/late September highs. They are either going to go up through the resistance level shown by the red line in the chart below or FAIL right here.
They have failed to maintain an initial breakout above those prior highs BY ABOUT ONE SINGLE POINT yesterday. But we'll have to see what the close brings.

Chart courtesy of Worden
Brothers, Inc. at FreeStockCharts.com.
CONCLUSION:The REITs may or may not be topping out here. If you see them pulling back further you could:
1. Take profits right here (see my page on "Passive Shorting™). The advantage is that you can re-enter HIGHER if you have to while protecting profits, especially in a tax deferred account.
YOU MUST BE WILLING TO RE-BUY if you sell for this to work!
2. Scale out in steps as we move lower. Sell a certain percentage of your holdings as we move down. Get my FREE report to the Scaling Out E-Booklet by subscribing to "Tips" in the box below for FREE AND then sending me a request via the "Contact link." Just say "Scaling Out" in the message and I'll send it to you.
3. Use an arbitrary stop of X percent on your entire position and sell once you've lost that much. That may prevent you from exiting early.
SUN AND STORM INVESTING™ MARKET TIMING BLOG on
10-14-2010:1:47 pm ET
Oil May Fall Next
Oil has made a double top with the August high in the light sweet crude near month futures of 82.97. A close back below that level, which we are under right now (per CNBC 82.68), may drive oil back down to the August low, bringing other commodities including gold and silver with it.
The chart below shows the top at the RED LINE and the potential target at the WHITE LINE:

Chart courtesy of Worden
Brothers, Inc. at FreeStockCharts.com.
You may want to wait for the close to decide whether to lighten up on oil related stocks or not. Consider your longer term investment plans as well.
SUN AND STORM INVESTING™ MARKET TIMING BLOG on
10-14-2010:8:28 am ET
The State of the US Dollar vs. Gold: Market Timing Signals
The US dollar has nearly reached levels achieved on 3-17-2008 and then again on 12-01-2009. The following chart below the whole story.
The US dollar seems stretched to the downside while gold is stretched to the upside. When things are very stretched, THEY OFTEN SNAP BACK, so in the least, I expect a rapid correction of the US dollar with gold heading down.
When? It could go to the very bottom of the trading range or bounce a bit early, but the bounce is likely just days away.
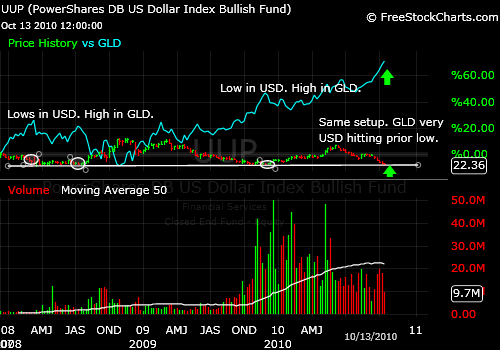
Chart courtesy of Worden
Brothers, Inc. at FreeStockCharts.com.
To get my detailed numbers on when and where to enter the dollar trade, simply subscribe BELOW to my FREE "Tips" newsletter, which gives you the password to my "Tips" page AND the US Dollar trade information to be posted this morning.
Simply enter your email address in one of the Subscription Boxes scroll either UP or DOWN.)
SUN AND STORM INVESTING™ MARKET TIMING BLOG on
10-13-2010:1:42 pm ET
The State of the Markets: Market Timing Signals
There are a number of signals running both UP and DOWN today.
POSITIVES:
-
The S&P 500 has broken above the wedge I wrote about yesterday (click on Market Forum on blue navigation bar to left to review those charts.)
-
Tech is up and has been leading again with AAPL (Apple) making a new high.
-
Small caps are strong, which often will not happen if the market is "reluctant" due to the greater difficulty funds have in getting out of small caps quickly when they need to.
-
Commodities have broken to the upside including oil which at the moment is above the August high in the near month futures. But by only a few cents, SO IT COULD REVERSE.
NEGATIVES:
-
Intel is selling off after a supposedly good earnings report. That is not a good sign for the general market ("selling the good news")
-
The banks are lagging the S&P 500 this afternoon.
-
JP Morgan sold off a bit after a failed rally attempt.
-
The US dollar is finding some support at the recent low and MAY rally driving down the prices of nearly everything else.
CONCLUSION: The markets continue to power upward, but as we are close to the April highs, a pullback seems likely. Selling ahead may not be wise as we could simply break above the April highs, but you could rebalance your portfolio here if you have big profits.
Read my webpage on "Passive shorting™" to understand how to sell at a top and protect profits. You MUST be willing to re-enter the markets higher if you sell however.
The relationship between STOCKS, GOLD, and the US DOLLAR is about to REAR its UGLY head again and the report I published for my FREE "Tips" subscribers will GIVE YOU WHAT YOU NEED TO KNOW.
Enter your email address to the UPPER RIGHT and then go to the FREE "Tip" page to READ THIS CRITICAL REPORT.
SIGN UP ON THE UPPER RIGHT:
SUN AND STORM INVESTING™ MARKET TIMING BLOG on
10-12-2010: 2:35 pm ET
The State of the Markets: Market Timing Signals
There are a number of signals running both UP and DOWN today.
POSITIVES:
-
If the S&P 500 can stay above 1157.16 and hold it by the close, the rally still has a chance.
-
The banks are leading the S&P 500 this afternoon.
-
Tech is up slightly and has been leading.
NEGATIVES:
The foreign and emerging markets are selling off.
The US dollar WAS a bit stronger in the morning, and is attempting to find a bottom after a long decline. That would make everything else go down in value, just as it went up while the dollar was rallying. A big move in the dollar to the UPSIDE is likely imminent. Has it happened? No. I'll be watching and brave investors can enter the dollar here (UUP for ex.) This will be bad for metals, oil and the rest of commodities, and stocks.
Gold is dropping both due to some selling as well as US dollar weakness.
-
This is dragging down the mining stocks (HUI index; GDX)
-
Oil has failed to hold a breakout above the August peak in the near month futures, which will pressure the CRB commodities index as well as oil related stocks.
CONCLUSION: There are negatives cropping up in the charts today and the timing is right for a sell-off in just about everything,except the US Dollar. It won't happen though until the S&P 500 breaks below the target discussed above.
SUN AND STORM INVESTING™ MARKET TIMING BLOG on
10-07-2010: 2:35 pm ET
The State of the Markets: Market Timing Signals
We finally have some real selling coming into the markets today.
Today's unemployment report pushed the markets up a bit and then they gave that gain back.
Here are the positives:
1. Small caps are down less than the market.
2. Tech is up slightly to flat.
3. REITs are up just slightlyand they led the market up.
Here are the negatives:
1. The banks are selling off more than the S&P 500, which is what is expected in a downturn.
2. Gold is selling off finally, at least somewhat (see post on gold/gold stocks later today!) The reason that matters is that gold and the stock markets have been running together against the US dollar.
3. Oil has toppped again, for now, failing at the August high breakout.
4. The US dollar is forming a base on the short term charts and is moving up a bit today. That move is NOT a signal, but the next big bump up could define an important low for the dollar (see dollar report later right here at SunAndStormInvesting.com too).
5. The markets are stretched for sure, now within spitting distance of the April highs or above them in the case of emerging markets. It may be that traders will take profits here.
6. The emerging markets are weaker than the US markets. Are they leading us down? It's too early to tell.
7. Where will the emerging markets be going without growth in the US and Europe? Those are their critical end markets. Endogenous growth alone is unlikely to support those economies.
These are hints about where the markets MAY head next. The markets are down somewhat but not to the extent they need to be to produce a sell signal. The markets may decide to wait for tomorrow's big unemployment report to make a decision. A very positive report could propel us to the April highs in a heartbeat. Then profits may finally be taken. A negative report may cause the start of an intermediate term down trend in the market -read that "SIGNIFICANT DECLINE" in the stock markets.
CONCLUSION: As long as the S&P 500 can close above 1157.16, the rally will be intact. It could actually trade a bit lower than that to around 1150 and survive, but the 1157.16 number will be the first "chink" taken out of the Bull armor.
